Every two years Gallup does a survey and asks working age adults if they intend to retire once they reach “full retirement age”. This is the age set by the Social Security department for when you qualify for retirement benefits. In years past this was 65 years old, but in an effort to salvage the Social Security system they extended the age. If you were born in 1937 or earlier full retirement age is still 65 but if you were born in 1960 or later full retirement age is 67. And in between, full retirement age gradually increases from 65 to 67. See the Social Security Administration’s Benefit By Year Of Birth chart.
Gallup Survey Results
In the 2017 survey, 25% of the respondents said they plan to retire as soon as they are eligible. And on the other end of the spectrum 11% said they expect to continue working full-time. And a whopping 63% of the people said they plan to continue working part-time. Although these numbers appear bad, they have improved over the previous surveys with a greater percentage saying they will retire and a lesser percentage saying they will work full-time. But the percentage of people who said they would work part-time has remained roughly the same.
| 2011 | 2013 | 2017 | |||||||||||||||||||||||||||||||||||||||||||||||||||||||||||||||||||||||||||||||||||||||||||||||||
|---|---|---|---|---|---|---|---|---|---|---|---|---|---|---|---|---|---|---|---|---|---|---|---|---|---|---|---|---|---|---|---|---|---|---|---|---|---|---|---|---|---|---|---|---|---|---|---|---|---|---|---|---|---|---|---|---|---|---|---|---|---|---|---|---|---|---|---|---|---|---|---|---|---|---|---|---|---|---|---|---|---|---|---|---|---|---|---|---|---|---|---|---|---|---|---|---|---|---|---|
| % | % | % | |||||||||||||||||||||||||||||||||||||||||||||||||||||||||||||||||||||||||||||||||||||||||||||||||
| Continue working, and work full time | 18 | 15 | 11 | ||||||||||||||||||||||||||||||||||||||||||||||||||||||||||||||||||||||||||||||||||||||||||||||||
| Continue working, and work part time | 63 | 61 | 63 | ||||||||||||||||||||||||||||||||||||||||||||||||||||||||||||||||||||||||||||||||||||||||||||||||
| Stop working altogether | 18 | 22 | 25 | ||||||||||||||||||||||||||||||||||||||||||||||||||||||||||||||||||||||||||||||||||||||||||||||||
| GALLUP | |||||||||||||||||||||||||||||||||||||||||||||||||||||||||||||||||||||||||||||||||||||||||||||||||||
The next question that arises is are they working because they “want to” or because they “have to”? Of those who say they will work full-time the majority say it because they want to rather than have to.
Of those who say they will work part-time, 44% say it is because they “want to” this is up from 34%.
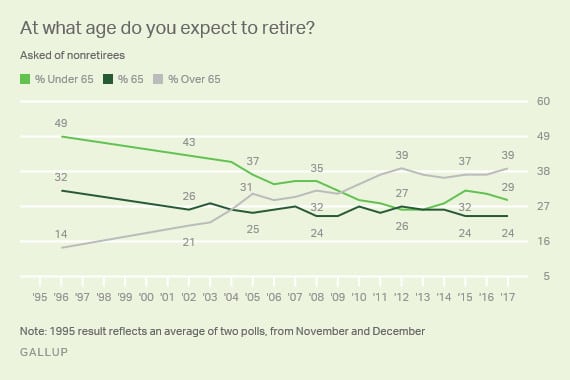
When asked, “What age do you intend to retire?” the percentage of respondents who said “under 65” has fallen pretty steadily since the survey began in 1995. While those saying over 65 has almost tripled from 14% in 1995 to 39% in 2017.
For those who have already retired the picture is quite different. 68% retired before age 65 and 30% retired at 65 or older. As you would expect during the “Great Recession” from 2008 to 2012 those who thought they would be able to retire under age 65 fell drastically as they saw their retirement funds evaporate. In 2008, 35% of the respondents expected to retire before age 65 but by 2012 only 27% thought they would be able to retire before age 65.
Read the full article at Gallup.

