The Bureau of Labor Statistics reported that: “Unemployment rates were higher in October in 26 states and stable in 24 states and the District of Columbia, the U.S. Bureau of Labor Statistics reported today. Twenty-one states had jobless rate decreases from a year earlier, 12 states and the District had increases, and 17 states had little change. The national unemployment rate, 3.9 percent, changed little both over the month and over the year.”
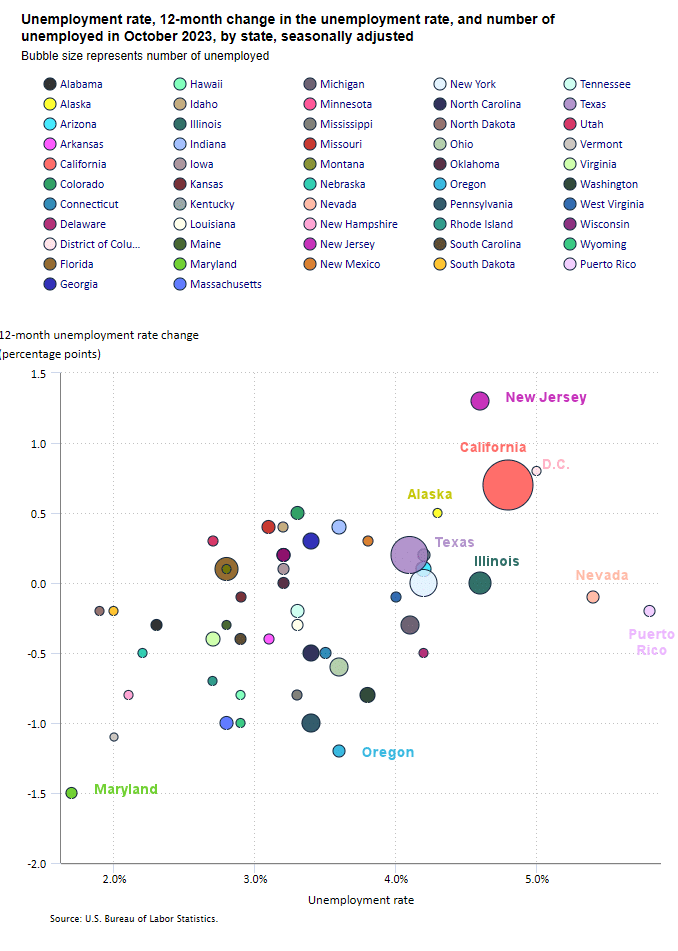
In the following chart, bubble size indicates the number of unemployed. As we can see the largest number of unemployed is the red California bubble followed by the purple Texas bubble.
The vertical axis indicates the percent change from a year ago. So, New Jersey has the biggest change from a year ago, followed by California and D.C. while the majority of states are below the zero line (indicating lower unemployment than a year ago). Maryland is the most improved followed by Oregon.
The horizontal axis indicates the current unemployment rate (in percent). Puerto Rico has the highest unemployment rate by far, followed by Nevada, D.C., California, New Jersey, and Illinois.
Source: BLS
Unemployment rate, 12-month change in the unemployment rate, and number of unemployed in October 2023, by state, seasonally adjusted
| State | Unemployment Rate | 12-month % Change | Number of Unemployed |
| Alabama | 2.3 | -0.3 | 52,196 |
| Alaska | 4.3 | 0.5 | 15,393 |
| Arizona | 4.2 | 0.1 | 154,888 |
| Arkansas | 3.1 | -0.4 | 42,549 |
| California | 4.8 | 0.7 | 931,250 |
| Colorado | 3.3 | 0.5 | 105,931 |
| Connecticut | 3.5 | -0.5 | 65,662 |
| Delaware | 4.2 | -0.5 | 21,420 |
| District of Columbia | 5.0 | 0.8 | 19,879 |
| Florida | 2.8 | 0.1 | 318,027 |
| Georgia | 3.4 | 0.3 | 182,959 |
| Hawaii | 2.9 | -0.8 | 19,419 |
| Idaho | 3.2 | 0.4 | 31,465 |
| Illinois | 4.6 | 0.0 | 296,641 |
| Indiana | 3.6 | 0.4 | 123,255 |
| Iowa | 3.2 | 0.1 | 55,980 |
| Kansas | 2.9 | -0.1 | 44,090 |
| Kentucky | 4.2 | 0.2 | 85,525 |
| Louisiana | 3.3 | -0.3 | 69,858 |
| Maine | 2.8 | -0.3 | 19,254 |
| Maryland | 1.7 | -1.5 | 55,437 |
| Massachusetts | 2.8 | -1.0 | 102,727 |
| Michigan | 4.1 | -0.3 | 206,982 |
| Minnesota | 3.2 | 0.2 | 100,080 |
| Mississippi | 3.3 | -0.8 | 40,221 |
| Missouri | 3.1 | 0.4 | 97,812 |
| Montana | 2.8 | 0.1 | 16,404 |
| Nebraska | 2.2 | -0.5 | 23,292 |
| Nevada | 5.4 | -0.1 | 87,235 |
| New Hampshire | 2.1 | -0.8 | 16,299 |
| New Jersey | 4.6 | 1.3 | 223,163 |
| New Mexico | 3.8 | 0.3 | 36,944 |
| New York | 4.2 | 0.0 | 409,462 |
| North Carolina | 3.4 | -0.5 | 179,425 |
| North Dakota | 1.9 | -0.2 | 7,867 |
| Ohio | 3.6 | -0.6 | 206,850 |
| Oklahoma | 3.2 | 0.0 | 62,081 |
| Oregon | 3.6 | -1.2 | 76,592 |
| Pennsylvania | 3.4 | -1.0 | 223,308 |
| Rhode Island | 2.7 | -0.7 | 15,631 |
| South Carolina | 2.9 | -0.4 | 71,886 |
| South Dakota | 2.0 | -0.2 | 9,862 |
| Tennessee | 3.3 | -0.2 | 113,506 |
| Texas | 4.1 | 0.2 | 625,365 |
| Utah | 2.7 | 0.3 | 49,249 |
| Vermont | 2.0 | -1.1 | 7,137 |
| Virginia | 2.7 | -0.4 | 122,703 |
| Washington | 3.8 | -0.8 | 153,526 |
| West Virginia | 4.0 | -0.1 | 31,978 |
| Wisconsin | 3.2 | 0.2 | 102,005 |
| Wyoming | 2.9 | -1.0 | 8,752 |
| Puerto Rico | 5.8 | -0.2 | 68,937 |
Maryland had the lowest jobless rate in October, 1.7 percent. The next lowest rate was in North Dakota, 1.9 percent. Nevada had the highest unemployment rate, 5.4 percent. In total, 26 states had unemployment rates lower than the U.S. figure of 3.9 percent, 4 states and the District of Columbia had higher rates, and 20 states had rates that were not appreciably different from that of the nation.
Editor’s Note: It is possible that part of the reason that the unemployment rate is so low is that people have withdrawn from the workforce due to COVID fears, homeschooling, or other reasons.
Twenty-one states had over-the-year unemployment rate decreases, the largest of which was in Maryland (-1.5 percentage points). Twelve states and the District of Columbia had rate increases from October 2022, the largest of which was in New Jersey (+1.3 percentage points). Seventeen states had jobless rates that were not notably different from those of a year earlier, though some had changes that were at least as large numerically as the significant changes.
Nonfarm Payroll Employment
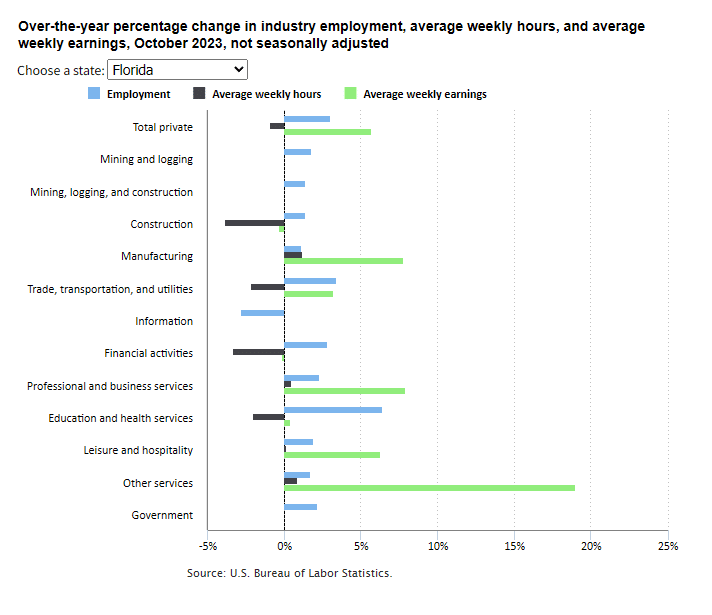
Over the year, nonfarm payroll employment increased in 34 states and was essentially unchanged in 16 states and the District of Columbia. The largest job gains occurred in Texas (+391,500), California (+285,300), and Florida (+278,400). The largest percentage increases occurred in Idaho (+3.5 percent) and Nevada (+3.4 percent), followed by Florida and Texas (+2.9 percent each).
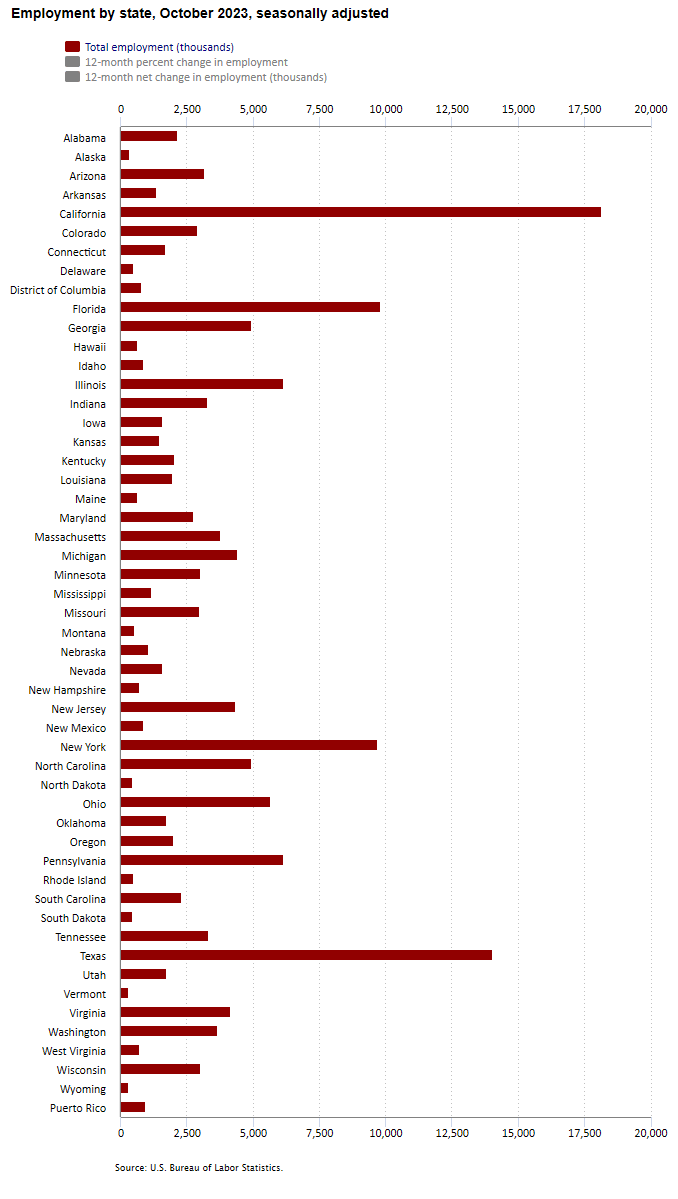
It is interesting to note that California, Texas, and now Florida each employ more people than New York (although Florida and New York are very close). Florida employed 9,824,000 and New York employed 9,716,800. In addition, New York has seen a reduction in its information services employment by -10.1% over the last year, in addition to smaller reductions in four other sectors.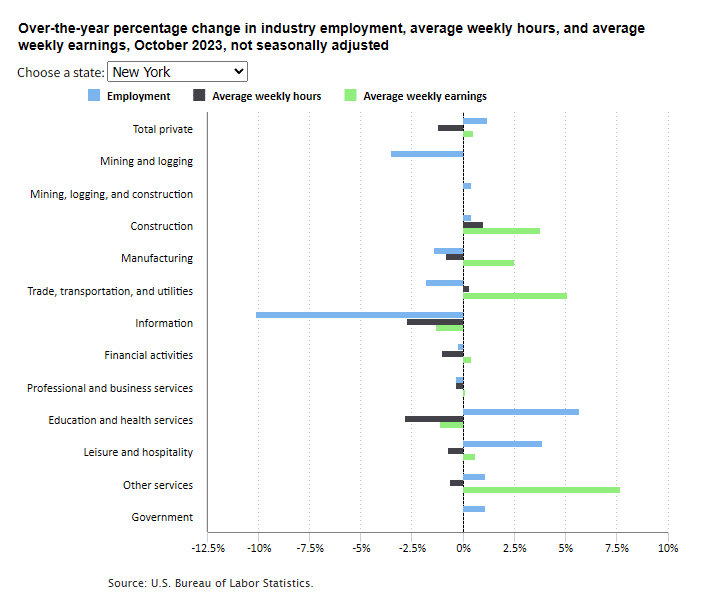
Florida has also had a reduction in information jobs but only by -2.8% and all other sectors have grown, with Education and Heath Services as the largest growth sector.