
The U.S. Bureau of Labor Statistics (BLS) released its employment / unemployment report for March on April 5th, 2024.
Employment / Unemployment
![]()
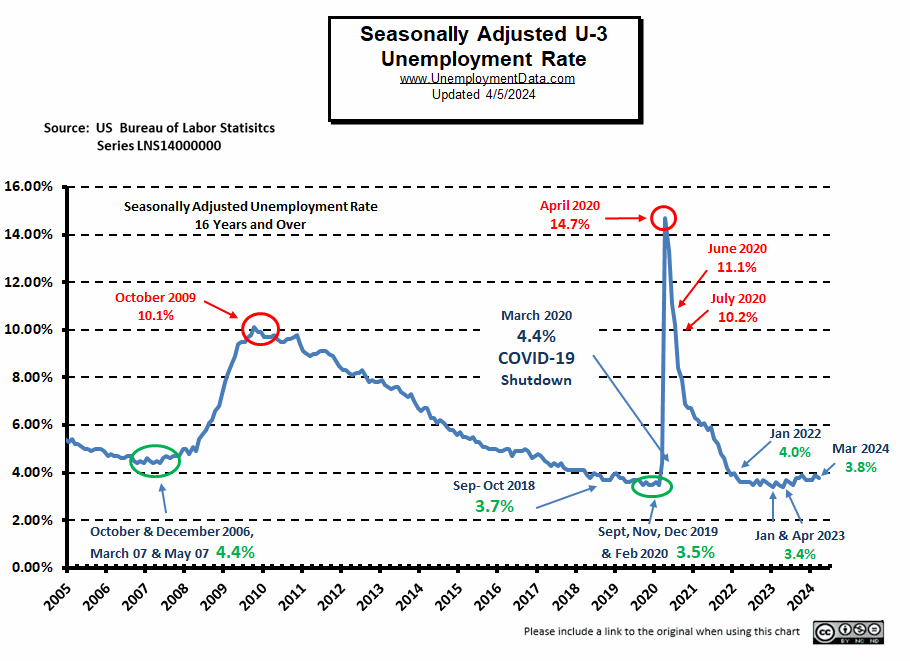
- Seasonally Adjusted U3: 3.8% down from 3.9% in February
- Unadjusted U3: 3.9% down from 4.2% in February
- Unadjusted U6: 7.4% down from 7.8% in February
- Labor Force Participation Rate: 62.7% up from 62.5%
- Employment: 157.218 million up from 156.559 million
- Next data release May 3rd 2024
Summary:
Total Employed increased in March, Labor Force Participation was up and Seasonally Adjusted Unemployment was down. Overall, an encouraging report. The market took this as a positive sign and rallied. The one concerning area is the continued increase in government employees as a percentage of overall employees.
According to the Commissioner of the U.S. Bureau of Labor Statistics:
“Total nonfarm payroll employment rose by 303,000 in March, and the unemployment rate changed little at 3.8 percent, the U.S. Bureau of Labor Statistics reported today. Job gains occurred in health care, government, and construction…”
“Among the major worker groups, the unemployment rate for Blacks (6.4 percent) increased in March, while the rates for Asians (2.5 percent) and Hispanics (4.5 percent) decreased. The
jobless rates for adult men (3.3 percent), adult women (3.6 percent), teenagers (12.6 percent), and Whites (3.4 percent) showed little or no change over the month…”
“The number of long-term unemployed (those jobless for 27 weeks or more), at 1.2 million, was little changed in March. The long-term unemployed accounted for 19.5 percent of all unemployed people. Both the labor force participation rate, at 62.7 percent, and the employment-population ratio, at 60.3 percent, were little changed in March. These measures showed little change over the year.”
You can read the full BLS report here.
As usual, they are talking about “Seasonally Adjusted Jobs”.
Looking at the Unadjusted Establishment Survey report we see…
Originally the BLS reported employment of 156.555 million for February which they adjusted to 156.559 million (for a gain of 4,000 jobs). They are currently reporting 157.218 million jobs for March which is actually a gain of 663,000 jobs compared to their original numbers. But many of these jobs came from government. Theoretically, the government could make the unemployment numbers continue to look good by simply hiring all the unemployed workers.
Government Employment
As indicated above, Government Employment is rising rapidly sucking up available employees and keeping the unemployment rate low.
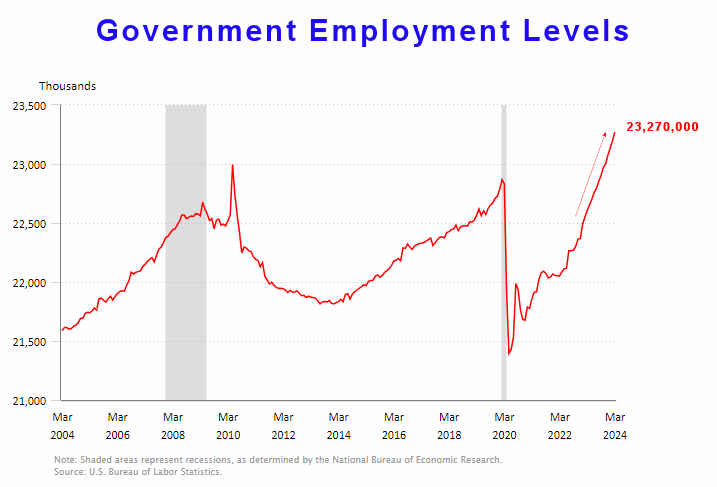
If we compare the above chart with the total Private Employment we can see that government employment is rising at a steeper rate than private employment. Initially, after COVID, private employment resumed sharply but then it leveled off some. But the government employment increase hasn’t leveled off.
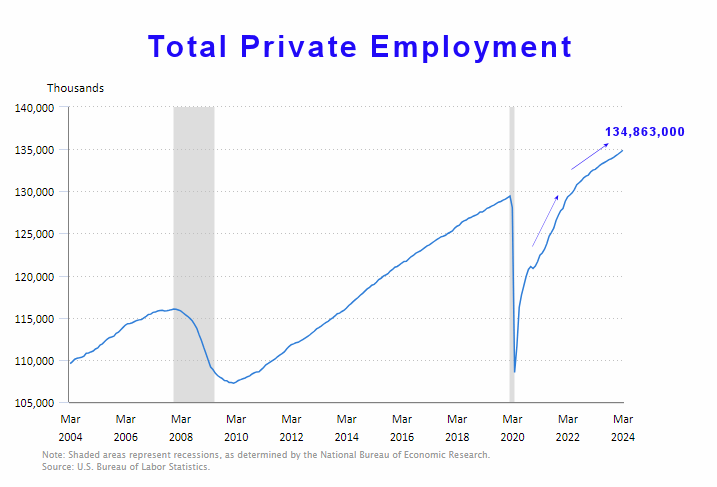 Total government employment is 23.270 million compared to a total private employment of 134.863 million.
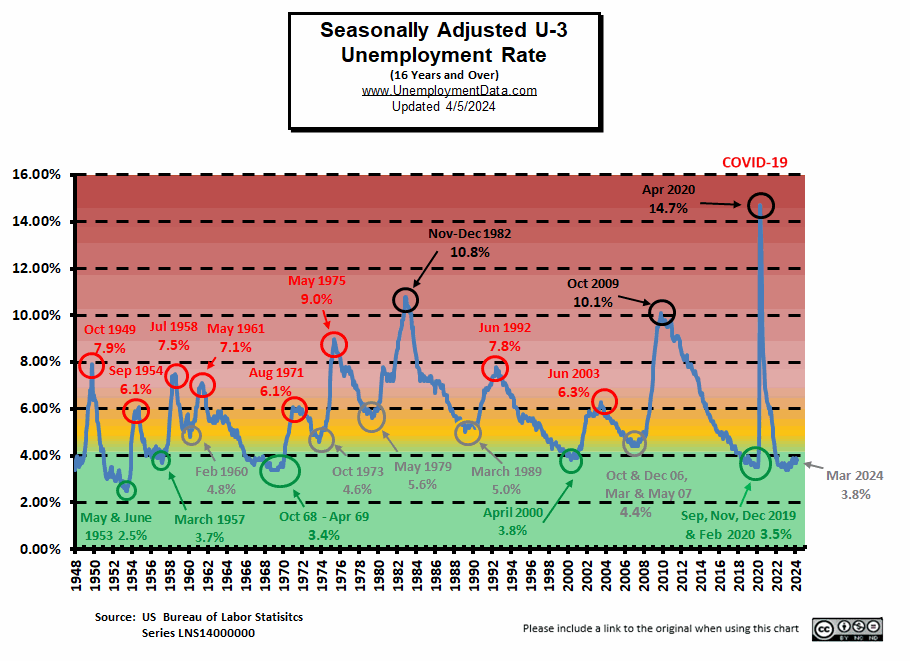
Current Unemployment Rate Chart
Seasonally Adjusted U3 Unemployment remains above the pre-COVID 2019 cyclical lows of 3.5%, as well as above the lows made early in 2023. But have retreated away from the “yellow zone.”
Current Employment Rate
Employment is Up from 156.559 million in February to 157.218 in March. Typically, the low point for each year occurs in January and then employment moves almost straight up to a small peak around June. February was slightly disappointing in this regard but March has restored the upward move.
Employment is 659,000 Above Year-Ago Levels and 6.250 million above February 2020 (prior to the Covid Crash)
However, the Civilian Population has increased by about 8.256 million since February 2020.
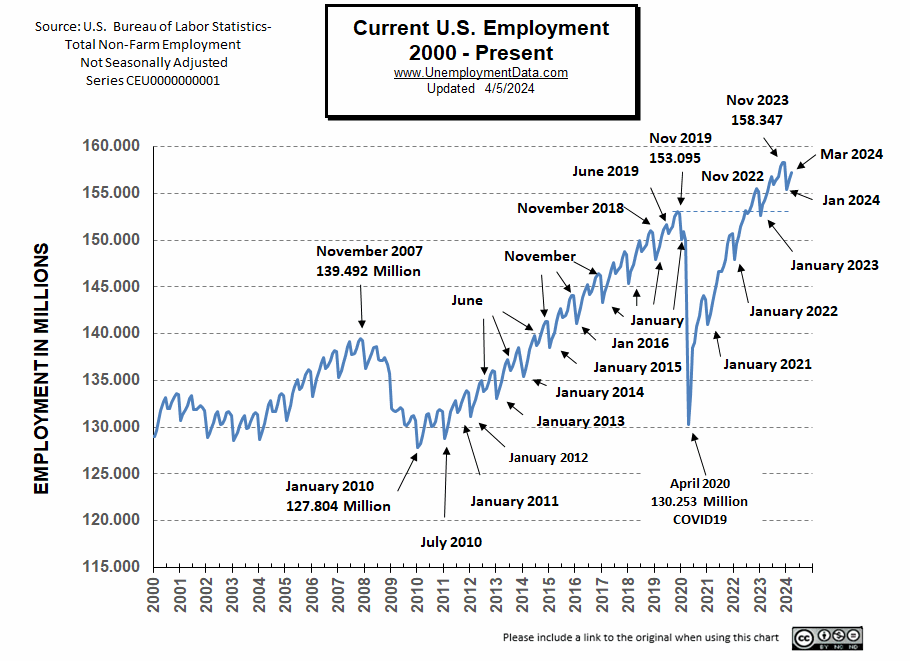
See Current Employment for more information.
BLS: March 2024 Employment by Sector
The BLS employment “bubble chart” based on the Establishment Survey Data gives us a good picture of the Seasonally adjusted employment numbers.
The Bubble’s Size tells us the total Employment for that industry (i.e., larger bubbles mean more people are employed in that sector).
The bubble’s location on the chart tells us that there has been a change in Employment Levels over the most recent month… A bubble further to the right indicates larger job growth. A bubble’s vertical location on the chart shows the average industry salary.
Remember, these are Seasonally Adjusted Numbers, so they aren’t cumulative!
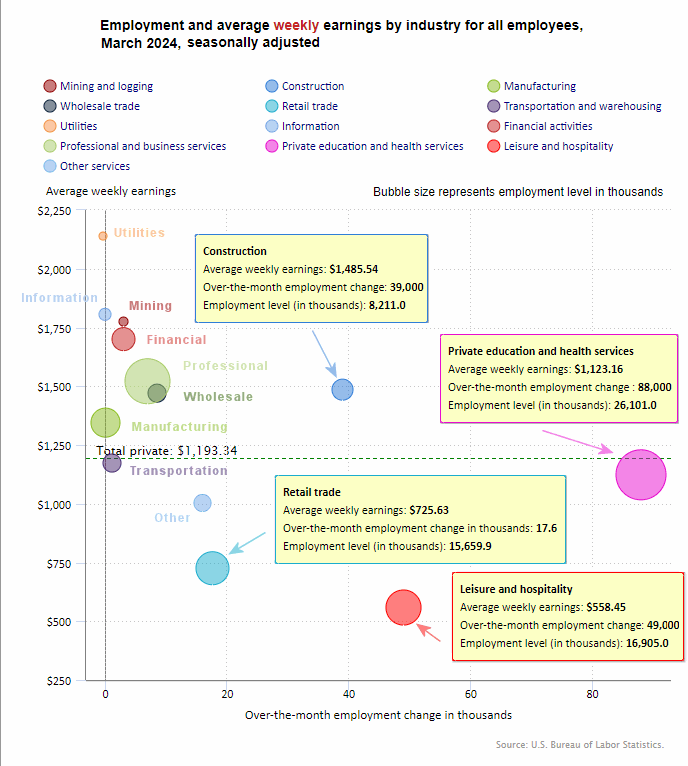
According to the BLS, Education and Health added another 88,000 jobs in March on top of the 85,000 jobs they added in February. Leisure and Hospitality Services added 49,000 jobs and Construction added 39,000 jobs. However, we need to remember that these are “seasonally adjusted jobs”.
Looking at their Non-Adjusted data, they are currently reporting 157.218 million jobs for March which is actually a gain of 663,000 jobs compared to their original numbers. But many of these jobs came from government, so theoretically, the government could make the unemployment numbers continue to look good by simply hiring all the unemployed workers.
BLS Average Weekly Wages
| Date | Average Weekly Wage |
| March 2024 | $1,193.34 |
| February 2024 | $1,185.75 |
| January 2024 | $1,178.16 |
| December 2023 | $1,175.46 |
| November 2023 | $1,173.04 |
| October 2023 | $1,166.20 |
| September 2023 | $1,165.47 |
| August 2023 | $1,163.41 |
| July 2023 | $1,157.28 |
| June 2023 | $1,155.15 |
| May 2023 | $1,146.99 |
| April 2023 | $1,147.58 |
| March 2023 | $1,141.34 |
| February 2023 | $1,141.61 |
| January 2023 | $1,146.14 |
| December 2022 | $1,125.73 |
| November 2022 | $1,129.01 |
| October 2022 | $1,124.01 |
| September 2022 | $1,119.87 |
| August 2022 | $1,116.42 |
| July 2022 | $1,116.54 |
| June 2022 | $1,106.76 |
| May 2022 | $1,105.47 |
| April 2022 | $1,102.01 |
| December 2021 | $1,086.46 |
BLS Employment and Average Weekly Earnings by Industry
March 2024, Seasonally Adjusted Employment
Note that due to “seasonal adjusting,” although they may claim that there was a “monthly increase” (or decrease), there isn’t always an actual increase; you can’t just subtract last month’s “employment level” from this month’s level. For instance, Mining employment was supposed to have gained 3,000 jobs in March. But February had 640,000 and March had 645,000 which looks more like a 5,000 increase. And Manufacturing went from 12,964,000 down to 12,956,000 but on an adjusted basis had no change instead of a decrease.
| Industry | Monthly Increase | Mar. Ave. Weekly Earnings | Mar. Employment Level | Feb. Employment Level |
| Total Private Employment | 232,000 | $1,193.34 | 134,863,000 | 134,628,000 |
| Mining and Logging | 3,000 | $1,775.14 | 645,000 | 640,000 |
| Construction | 39,000 | $1,485.54 | 8,211,000 | 8,162,000 |
| Manufacturing | 0 | $1,345.20 | 12,956,000 | 12,964,000 |
| Wholesale trade | 8,500 | $1,470.55 | 6,158,400 | 6,155,000 |
| Retail trade | 17,600 | $725.63 | 15,659,900 | 15,636,600 |
| Transportation and Warehousing | 1,200 | $1,173.12 | 6,540,500 | 6,511,400 |
| Utilities | -400 | $2,139.10 | 588,000 | 588,900 |
| Information | 0 | $1,806.02 | 3,017,000 | 3,020,000 |
| Financial Activities | 3,000 | $1,700.65 | 9,226,000 | 9,233,000 |
| Professional and Business Services | 7,000 | $1,521.32 | 22,954,000 | 22,931,000 |
| Private Education and Health Services | 88,000 | $1,123.16 | 26,101,000 | 26,023,000 |
| Leisure and Hospitality | 49,000 | $558.45 | 16,905,000 | 16,882,000 |
| Other Services | 16,000 | $1,003.24 | 5,901,000 | 5,881,000 |
Source: BLS
ADP® National Employment Report
ADP provides an independent (non-government) estimate of private-sector employment and pay, based on data derived from ADP client payrolls. According to ADP®, In collaboration with Stanford Digital Economy Lab.
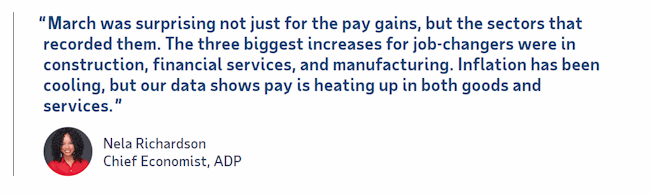
ADP: Private employers added 184,000 jobs in March
- Last month saw the biggest jump in hiring since July, led by leisure and hospitality. Job gains were strong across industries with the exception of professional services, where hiring fell.
Source: ADP® Pay Insights
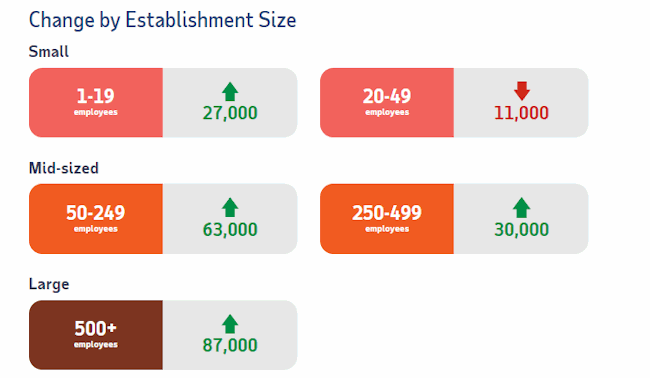
ADP Private Employment by Establishment Size
As we can see from the graphic below most establishment sizes had positive gains. The only sector that declined slightly were those establishments with 20-49 employees.
March ADP Changes:
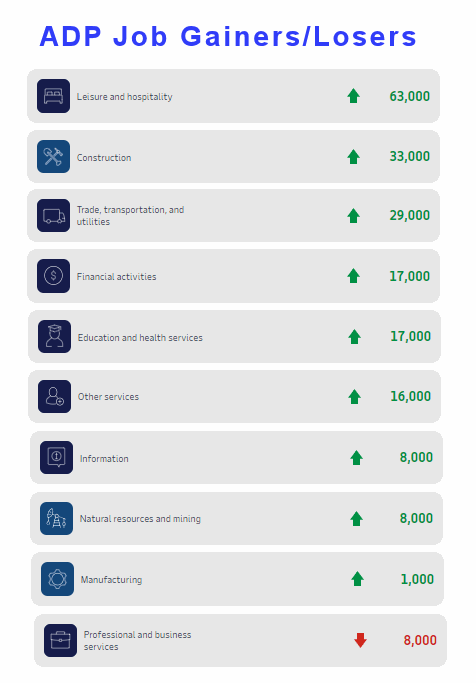
ADP Job Gainers / Losers
ADP provides an entirely different picture of the job situation compared to the BLS perspective showing gains in almost all sectors, except for Professional and Business Services.
Unemployment
March’s Seasonally Adjusted Unemployment is down from 3.9% to 3.8%.
March’s Labor Force Participation Rate
The LFPR is up from 62.5% to 62.7%.
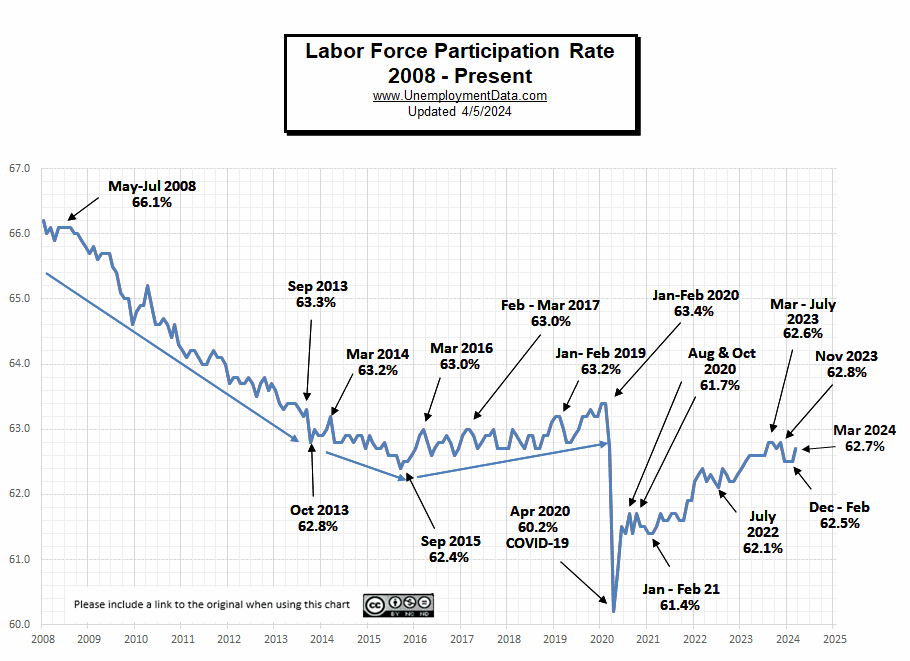 See Labor Force Participation Rate for more information.
Near Full Employment
This chart compares employment levels with the (inverted) unemployment rate.
Full Employment is when everyone who wants a job has one. It is generally considered to be around 3%. After the unemployment rate almost touched the magic full employment line in April, it began moving away (i.e., higher unemployment). And in January it retreated further from full employment.
Note: The Unemployment rate is inverted to track the employment rate. Neither is Seasonally Adjusted. For more information see Employment vs. Unemployment.
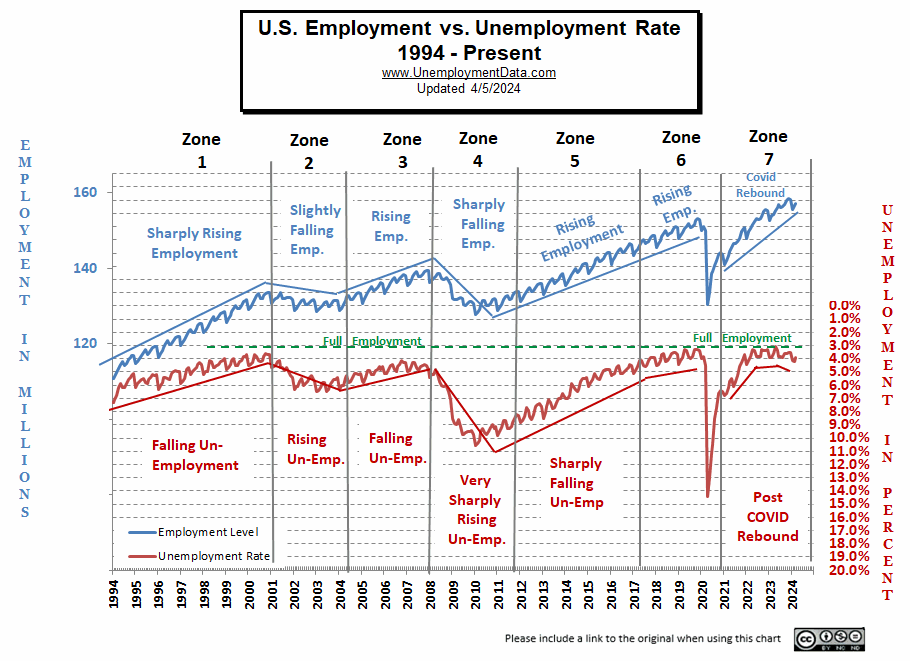
Note: Full employment is not considered to be at zero percent because even when employers are having difficulty finding employees, some people are still unemployed due to either structural unemployment (mismatch between worker skills and job requirements, i.e., not enough training) or simply because they quit their job knowing it would be easy to find another (hopefully better) job. Often referred to as frictional unemployment (there will always be people who have quit or have lost a seasonal job and are in the process of getting a new job).
Seasonally Adjusted U1 through U6 Unemployment Rates
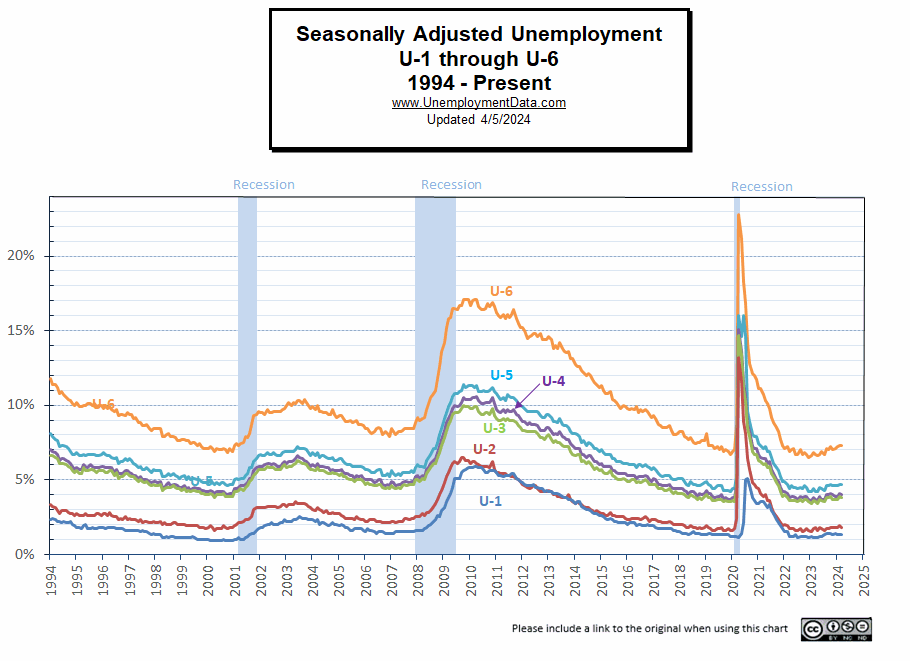 For more information about the various measurements of unemployment, see What Is U-6 Unemployment?
Seasonally Adjusted Unemployment by Education
Unemployment by the less educated fell drastically from 6.1% to 4.9% in March.
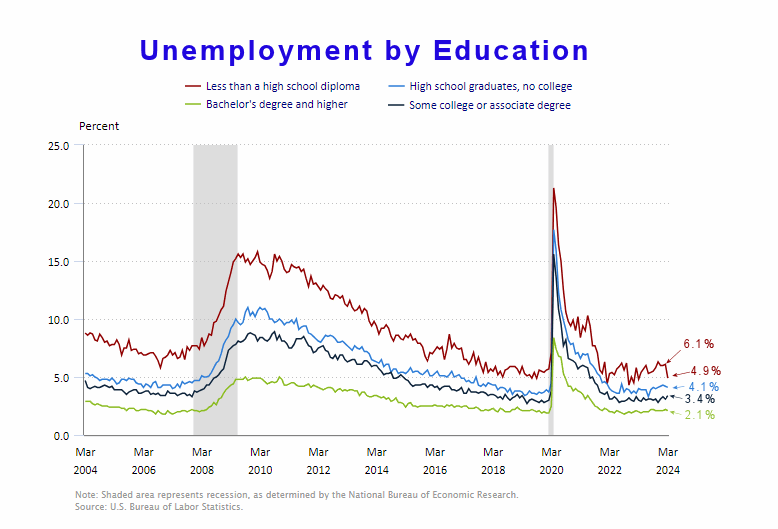
Source: BLS
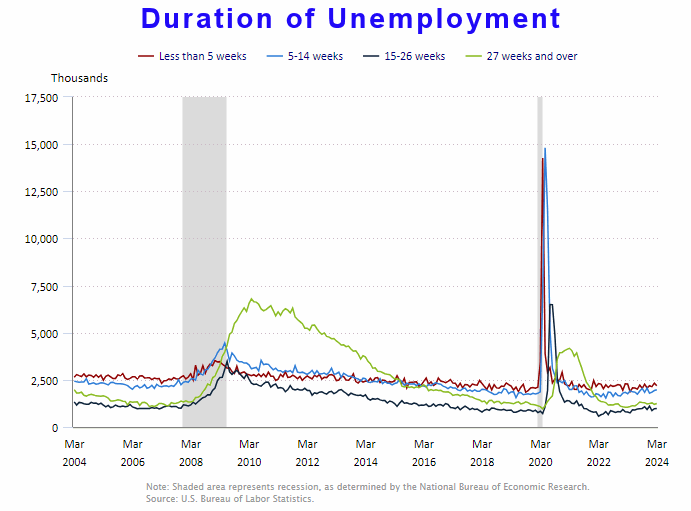
Duration of Unemployment
Early signs of weakness are when people stay unemployed for longer, i.e., when the 5-14 week line (blue) crosses above the 5 week (red) line. Fortunately, the red line is still on top indicating that most of those unemployed only stay that way for a short time. Final confirmation of a full-blown recession happens when the 27 week line (green) crosses to the top. This often remains, long after the official recession ends.
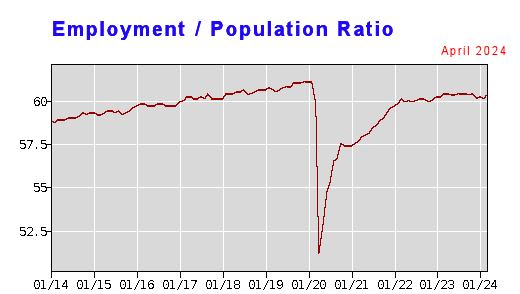
Employment-Population Ratio
The Employment / Population ratio was 60.5% in November, December was 60.1%, 60.2% in January, 60.1% in February. In March it rebounded slightly to 60.3% (still below the November peak).
Employment / Population Ratio by Race
Drilling down further into the Employment / Population ratio you can break it down by race. Looking the percentage of the population that is working based on race we can see that apparently Hispanics have a much larger percentage of their population working than African Americans. Although I didn’t include it on this chart the White population falls between the two but is much more erratic while these two track fairly consistently. Incidentally, the Hispanic population and the Asian population are very close in their percentages both having a much higher percentage working than Whites or Blacks.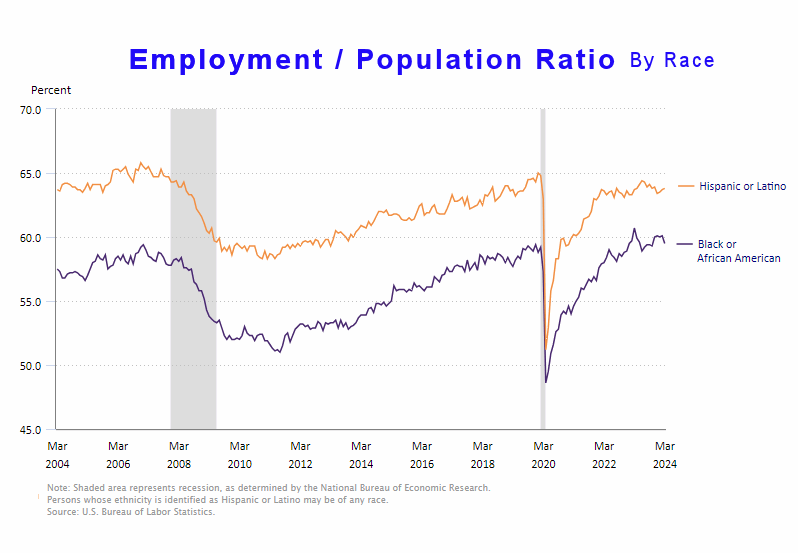
See Employment Population Ratio for more information.
Read more on UnemploymentData.com.
- Exploring the Benefits of a Career in Truck Driving
- Cranes in Construction: A Sky-High Opportunity for Entrepreneurs
- Preparing for a Career in Medicine: What You Need to Know
- How to Create a Car Hauling Business
- February Unemployment Increases
From InflationData.com
- Hyperinflation- How a Trickle Can Turn into a Flood
- Inflation, High Inflation, and Hyperinflation
- Industries Most Affected by Inflation: Insights from the Global Supply Chain
- Have Wages Kept Up with Inflation in 2023?
- Inflationary Expectations Do Not Cause Inflation
From Financial Trend Forecaster
- NYSE ROC Chart
- NASDAQ ROC Chart
- Crypto 2.0, A Whole New Ballgame
- California’s Latest Hustle: Utility Bills Based on Ratepayers’ Income
- The Barbarous Relic Rides Again
- Argentina Sees First Monthly Budget Surplus in 12 Years
- Federal Student Loans Drive Up College Tuition Levels
- America’s Fiat Money Gestapo: The Untold History of the Secret Service
- Argentina Mulls Dollarization- What is it?
From Elliott Wave University
- A.I. Revolution and NVDA: Why Tough Going May Be Ahead
- Free report: ‘Gold Investors’ Survival Guide’
- U.S. Real Estate: A 24% Problem
- Update on China’s Big Housing Bust
- Mini-Manias: Beware Short-Term Trading Frenzies – Like This One
From OptioMoney
- What are “Moving Loans” and Do You Need One?
- Navigating Currency Exchange: Maximizing Your Money When Moving Abroad
- The True Cost of Neglect: How Deferred Home Maintenance Creates Money Pits
- Financial Factors to Consider When Relocating Your Business
- Nomad Living: Managing Finances for a Mobile Lifestyle
From Your Family Finances