
The U.S. Bureau of Labor Statistics (BLS) released its employment / unemployment report for January on February 2nd, 2024.
Employment / Unemployment
![]()
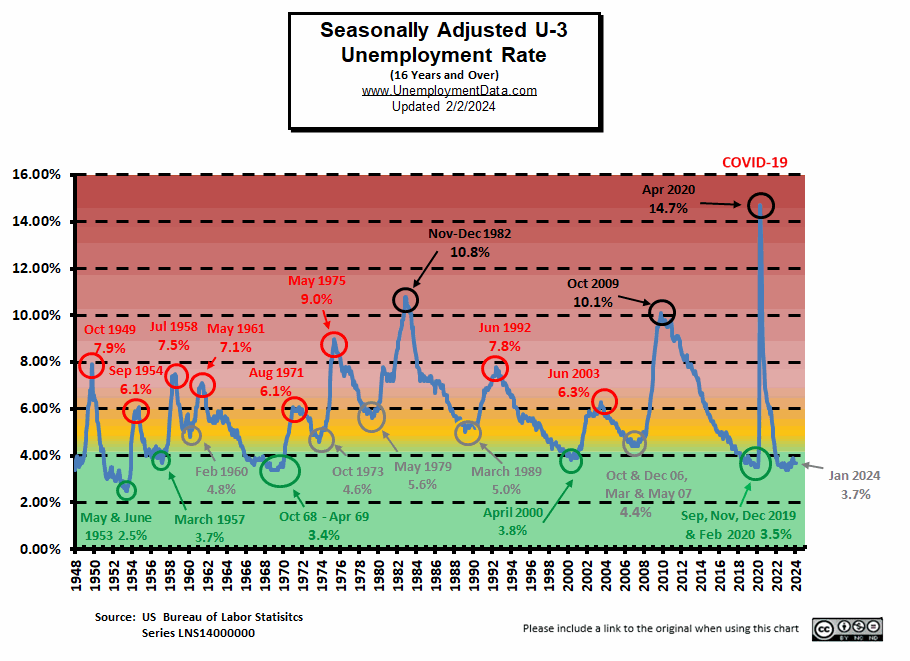
- Adjusted U-3 was 3.7% unchanged since November
- Unadjusted U-3 was 4.1% up from 3.5% in December
- Unadjusted U-6 was 8.0% Up from 6.7% in November and 7.0% in December
- Labor Force Participation was 62.5% unchanged from December but down from 62.8% in November
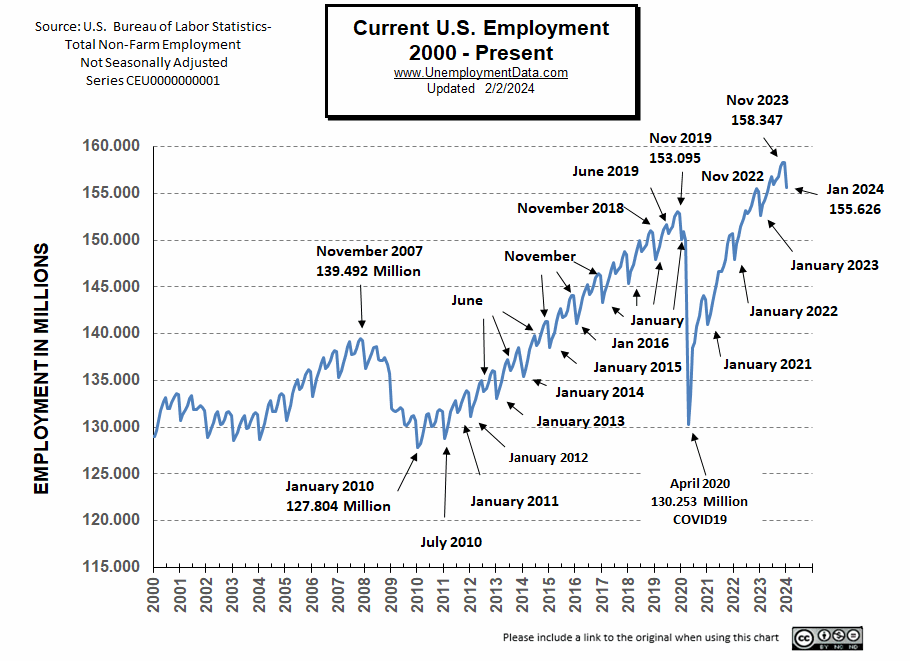
- Unadjusted Employment fell from 158.261 million to 155.626 million
Summary:
Seasonally Adjusted Employment rose but actual employment decreased in January, Labor Force Participation was unchanged, Seasonal Adjustment indicates employment decline is normal for this time of year.
According to the Commissioner of the U.S. Bureau of Labor Statistics:
“Total nonfarm payroll employment rose by 353,000 in January, and the unemployment rate
remained at 3.7 percent, the U.S. Bureau of Labor Statistics reported today. Job gains
occurred in professional and business services, health care, retail trade, and social
assistance. Employment declined in the mining, quarrying, and oil and gas extraction
industry…”
“In January, the unemployment rate was 3.7 percent for the third month in a row, and
the number of unemployed people was little changed at 6.1 million…”
“The number of long-term unemployed (those jobless for 27 weeks or more), at 1.3 million,
was little changed in January. The long-term unemployed accounted for 20.8 percent of all unemployed people.”
As usual, they are talking about “Seasonally Adjusted Jobs”.
Looking at the Unadjusted Establishment Survey report we see…
Originally the BLS reported employment of 158.228 million for December which they adjusted to 158.261 million in January (for a gain of 33,000 jobs). They are currently reporting 155.626 million jobs for January which is actually a loss of -2,602,000 jobs compared to their original numbers. But January typically loses about this many jobs, so the seasonally adjusted unemployment rate stayed the same.
BLS Source
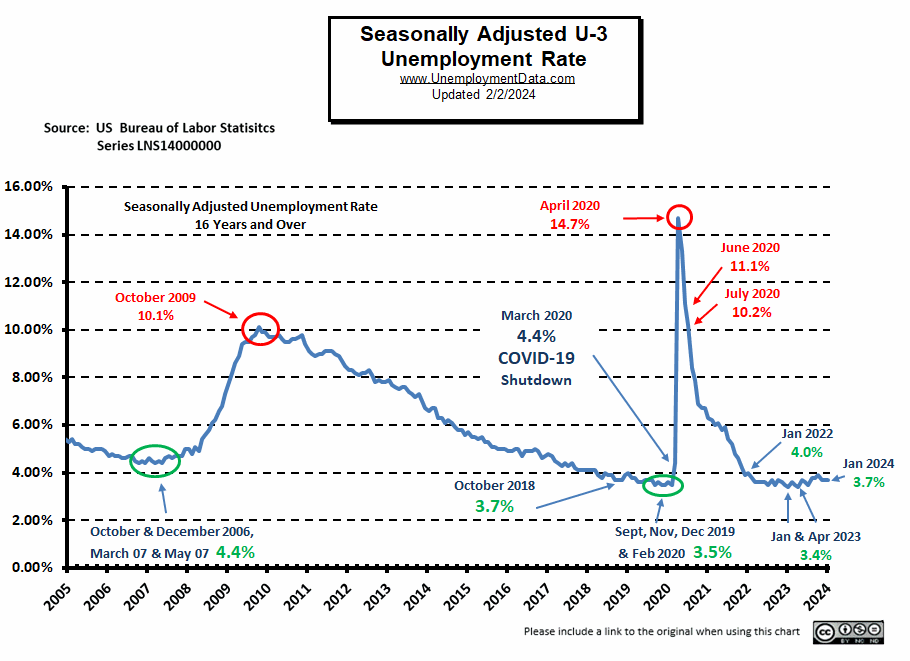
Current Unemployment Rate Chart
Seasonally Adjusted Unemployment is slightly above the pre-COVID 2019 cyclical lows of 3.5% as well as above the lows made early in 2023. Current levels are still within the “Green Zone”.
Current Employment Rate
At 155.626 million, Employment is down from the originally reported 158.228 million in December
Typically, the low point for each year occurs in January so these numbers are not unexpected. Typically, after January employment moves almost straight up to a small peak around June with a slight drop around July, and then the highest peak in employment happens in November with a slight decline in December.
Employment is 2.938 million Above Year-Ago Levels
and 4.658 million above February 2020 (prior to the Covid Crash)
However, the Civilian Population has increased by about 7.912 million since February 2020.
 2023 Summary
In January 2023, we had the typical drop taking employment slightly below the 2019 peak. In June, employment at 156.905 million was above the November 2022 peak. And in July we got the typical slight drop to 156.126 million. August and September followed the typical pattern with September very slightly higher than June.
See Current Employment for more information.
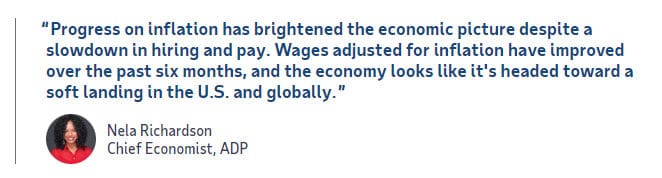
ADP® National Employment Report
ADP provides an independent (non-government) estimate of private-sector employment and pay, based on data derived from ADP client payrolls. According to ADP®, In collaboration with Stanford Digital Economy Lab.
ADP: Private employers added 107,000 jobs in January
- The hiring slowdown of 2023 spilled into January, and pressure on wages continues to ease. The pay premium for job-switchers shrank to a new low last month.
Source: ADP® Pay Insights
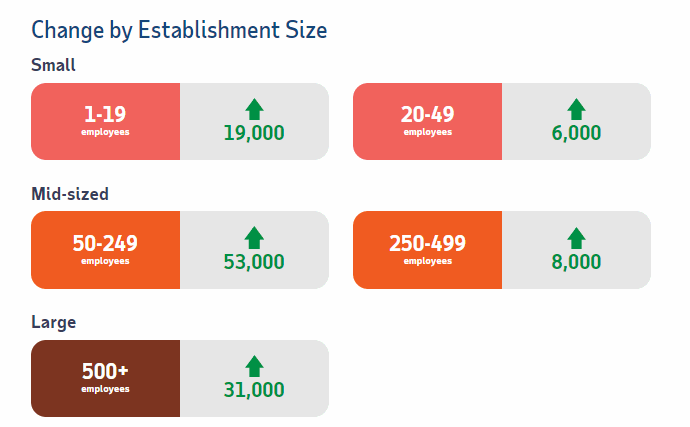
ADP Private Employment by Firm Size
ADP also lists increases by “firm size”.
January ADP Changes:
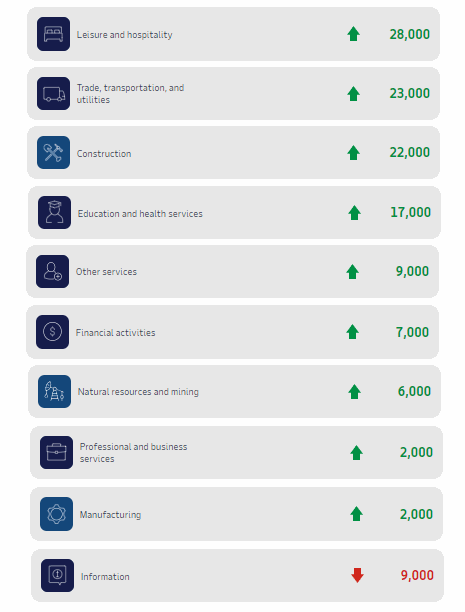
ADP Job Gainers/Losers
ADP provides an entirely different picture of the job situation compared to the BLS perspective showing gains in almost all sectors except information.
BLS: January 2024 Employment by Sector
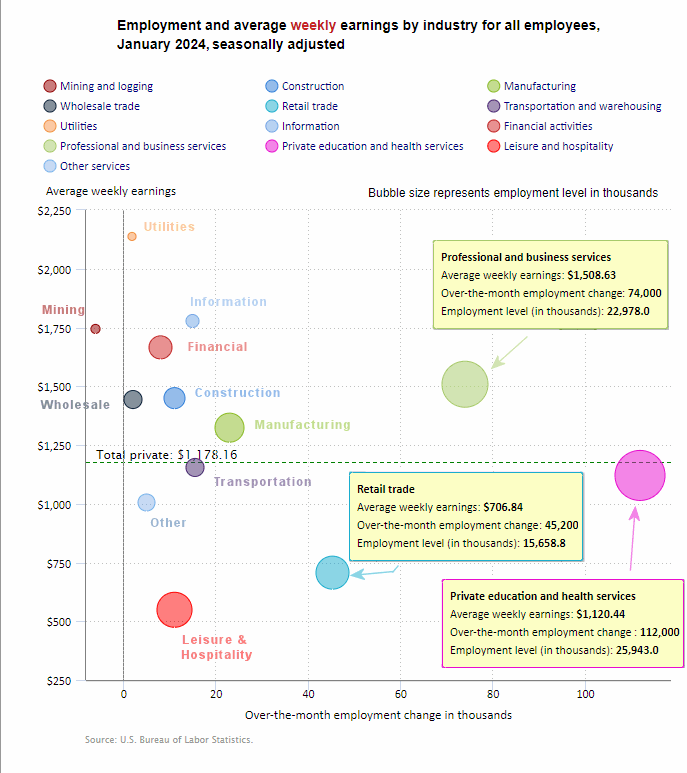
The BLS employment “bubble chart” gives us a comparable picture to the ADP data using Seasonally adjusted numbers. Whereas ADP says the biggest gainer was Leisure and Hospitality, the BLS says it was Education and Health.
The Bubble’s Size tells us the total Employment for that industry (i.e., larger bubbles mean more people are employed in that sector).
The bubble’s location on the chart tells us that there has been a change in Employment Levels over the most recent month… A bubble further to the right indicates larger job growth. A bubble’s vertical location on the chart shows the average industry salary.
Remember, these are Seasonally Adjusted Numbers, so they aren’t cumulative!
According to the BLS Education and Health added 112,000 jobs and Professional Services added 74,000 jobs. However, we need to remember that these are “seasonally adjusted jobs”. According to the BLS Non-Adjusted Establishment Survey Data, they are currently reporting 155.626 million jobs for January which is actually a loss of -2,602,000 jobs compared to 158.228 million jobs originally reported for December. But January typically loses about this many jobs, so the seasonally adjusted unemployment rate stayed the same.
BLS Average Weekly Wages
| Date | Average Weekly Wage |
| January 2024 | $1,178.16 |
| December 2023 | $1,175.46 |
| November 2023 | $1,173.04 |
| October 2023 | $1,166.20 |
| September 2023 | $1,165.47 |
| August 2023 | $1,163.41 |
| July 2023 | $1,157.28 |
| June 2023 | $1,155.15 |
| May 2023 | $1,146.99 |
| April 2023 | $1,147.58 |
| March 2023 | $1,141.34 |
| February 2023 | $1,141.61 |
| January 2023 | $1,146.14 |
| December 2022 | $1,125.73 |
| November 2022 | $1,129.01 |
| October 2022 | $1,124.01 |
| September 2022 | $1,119.87 |
| August 2022 | $1,116.42 |
| July 2022 | $1,116.54 |
| June 2022 | $1,106.76 |
| May 2022 | $1,105.47 |
| April 2022 | $1,102.01 |
| December 2021 | $1,086.46 |
BLS Employment and Average Weekly Earnings by Industry
January 2024, Seasonally Adjusted Employment
We’ve added a column to the table below showing the employment levels the BLS reported the previous month. Note that due to “seasonal adjusting,” although they may claim that there was a “monthly increase” (or decrease), there isn’t always an actual increase; you can’t just subtract last month’s “employment level” from this month’s level. For instance, Construction employment was supposed to have increased by 11,000 in January. But January had 8,137,000 and December had 8,056,000 which looks more like an 81,000 increase. And Manufacturing decreased from 12,986,000 to 12,979,000 but on an adjusted basis had a 23,000 increase.
| Industry | Dec. Monthly Increase | Jan. Ave. Weekly Earnings | Jan. Employment Level | Dec. Employment Level |
| Total Private Employment | 317,000 | $1,178.16 | 134,609,000 | 134,229,000 |
| Mining and Logging | -6,000 | $1,743.86 | 635,000 | 641,000 |
| Construction | 11,000 | $1,449.43 | 8,137,000 | 8,056,000 |
| Manufacturing | 23,000 | $1,323.75 | 12,979,000 | 12,986,000 |
| Wholesale trade | 2,100 | $1,443.51 | 6,164,900 | 6,099,000 |
| Retail trade | 45,200 | $706.84 | 15,658,800 | 15,543,300 |
| Transportation and Warehousing | 15,500 | $1,154.44 | 6,556,000 | 6,642,200 |
| Utilities | 1,800 | $2,137.42 | 585,500 | 561,800 |
| Information | 15,000 | $1,777.56 | 3,032,000 | 3,051,000 |
| Financial Activities | 8,000 | $1,665.44 | 9,248,000 | 9,148,000 |
| Professional and Business Services | 74,000 | $1,508.63 | 22,978,000 | 22,946,000 |
| Private Education and Health Services | 112,000 | $1,120.44 | 25,943,000 | 25,878,000 |
| Leisure and Hospitality | 11,000 | $548.76 | 16,824,000 | 16,782,000 |
| Other Services | 5,000 | $1,005.28 | 5,868,000 | 5,895,000 |
Source: BLS
Unemployment
January’s Seasonally Adjusted Unemployment is unchanged at 3.7%.
January’s Labor Force Participation Rate
The LFPR is unchanged at 62.5% down from 62.8% in November.
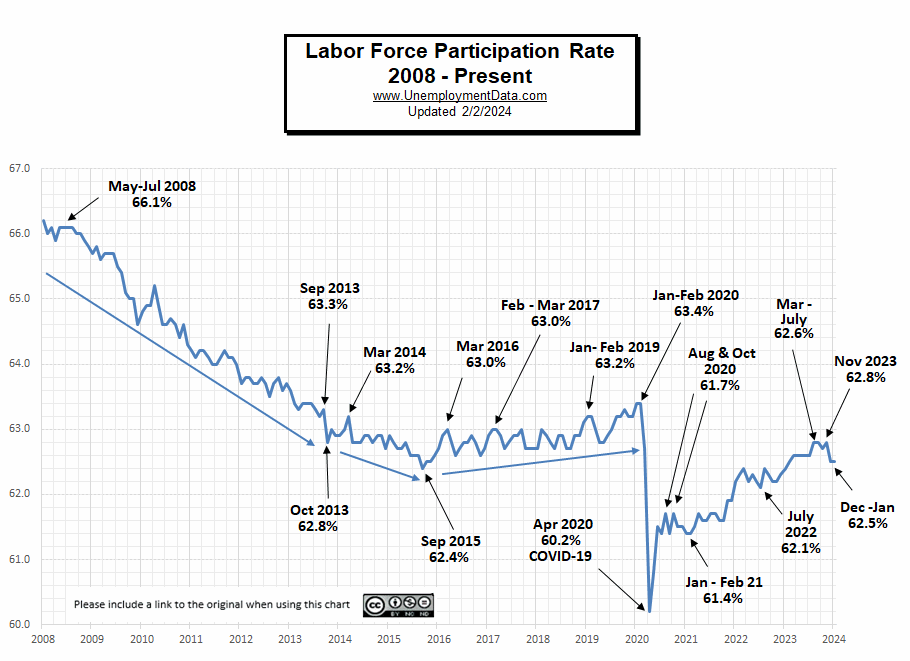 See Labor Force Participation Rate for more information.
Still Near Full Employment
This chart compares employment levels with the (inverted) unemployment rate.
Full Employment is when everyone who wants a job has one. It is generally considered to be around 3%. After the unemployment rate almost touched the magic full employment line in April, it began moving away (i.e., higher unemployment). And in January it retreated further from full employment.
Note: The Unemployment rate is inverted to track the employment rate. Neither is Seasonally Adjusted. For more information see Employment vs. Unemployment.
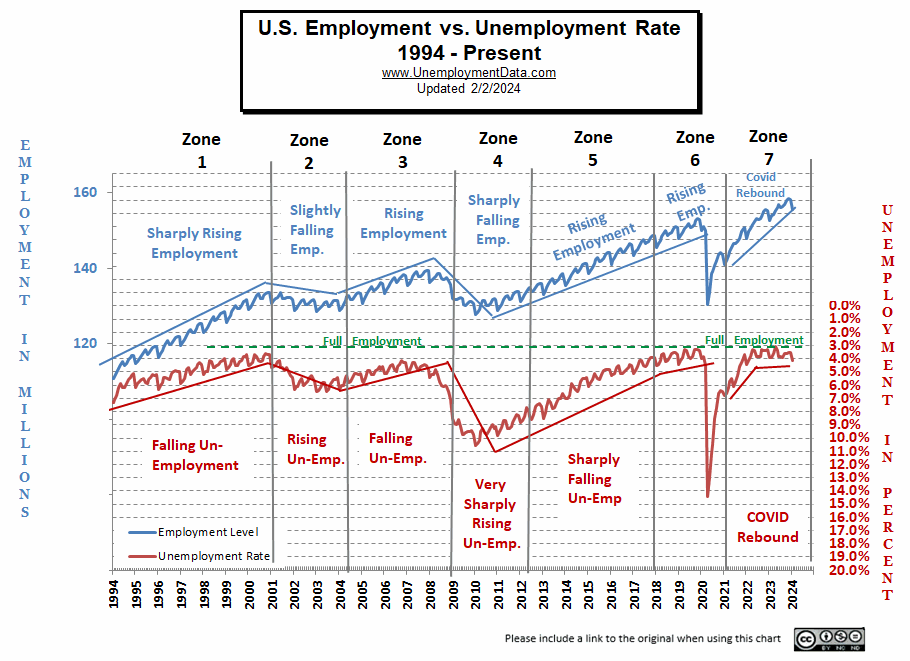
Note: Full employment is not considered to be at zero percent because even when employers are having difficulty finding employees, some people are still unemployed due to either structural unemployment (mismatch between worker skills and job requirements, i.e., not enough training) or simply because they quit their job knowing it would be easy to find another (hopefully better) job. Often referred to as frictional unemployment (there will always be people who have quit or have lost a seasonal job and are in the process of getting a new job).
Seasonally Adjusted U1 through U6 Unemployment Rates
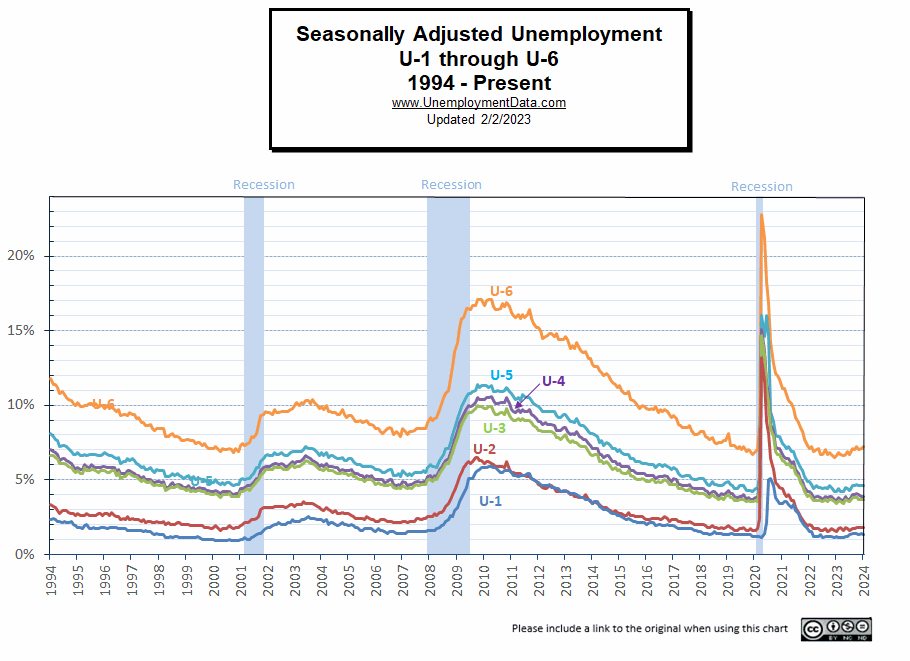 For more information about the various measurements of unemployment, see What Is U-6 Unemployment?
Seasonally Adjusted Unemployment by Education
Despite the other numbers indicating a healthy jobs market, unemployment by the less educated has been rising indicating potential weakness.
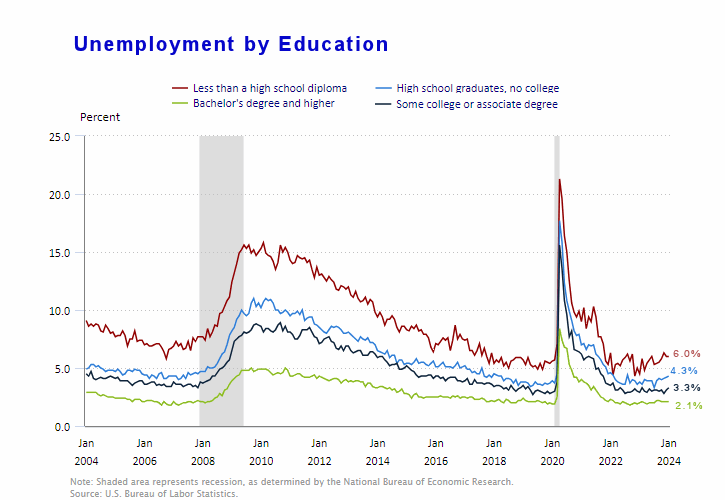 Source: BLS
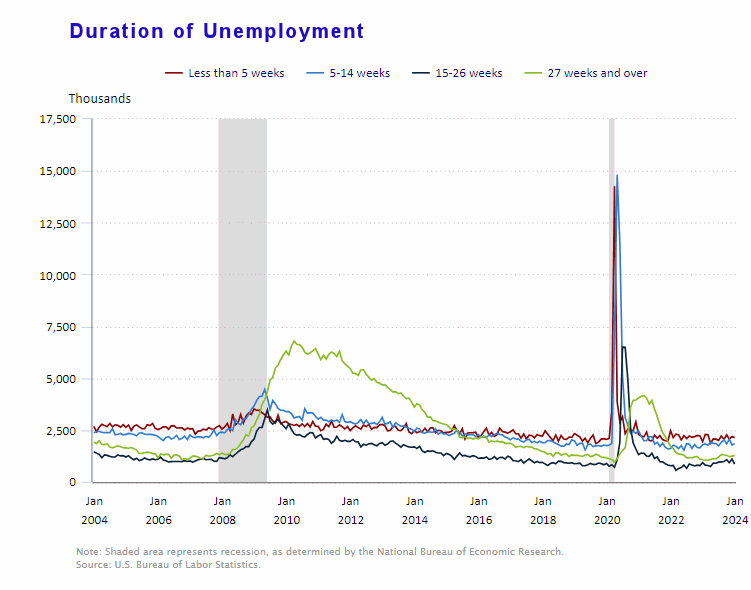
Duration of Unemployment
Early signs of weakness are when the 5-14 week line (blue) crosses above the 5 week (red) line, which hasn’t happened yet. Further confirmation of a full-blown recession happens when the 27 week line (green) crosses to the top. This often remains, long after the official recession ends.
Employment-Population Ratio
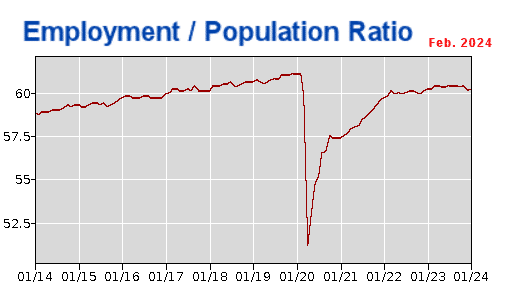
The Employment / Population ratio rose from 60.2% of the population employed in October to 60.5% in November, it fell in December to 60.1% and rose to 60.2% in January.
See Employment Population Ratio for more information.
Read more on UnemploymentData.com.
- Veterans Wanted | 6 Trades Veterans Can Excel In
- Find Your Calling: Fantastic Career Ideas in the Medical Field
- How to Make a Living as a Sound Engineer
- December Unemployment Unchanged
- Conquer the Skies and Stand Out as an Aviation Medical Examiner
From InflationData.com
- Have Wages Kept Up with Inflation in 2023?
- Inflationary Expectations Do Not Cause Inflation
- Inflation and its Impact on Marketing Budgets
- December Inflation Increases to 3.35%
- Not All Prices Have Inflated Since 1964
- Worldwide Inflation by Country in 2023
From Financial Trend Forecaster
- Moore Inflation Predictor
- NYSE ROC
- NASDAQ ROC
- Federal Student Loans Drive Up College Tuition Levels
- America’s Fiat Money Gestapo: The Untold History of the Secret Service
- Argentina Mulls Dollarization- What is it?
- The Fed Is Draining Our Economy Like Farmers Have Drained Their Aquifers
- If the Economy Is So Great, Why Are Tax Revenues So Weak?
- U.S. Real Estate: A 24% Problem
- Update on China’s Big Housing Bust
- Mini-Manias: Beware Short-Term Trading Frenzies – Like This One
- Why You Should Expect a Once-in-a-Lifetime Debt Crisis
- Why Do Traders Really Lose Money?
From OptioMoney.com
- The True Cost of Neglect: How Deferred Home Maintenance Creates Money Pits
- Financial Factors to Consider When Relocating Your Business
- Nomad Living: Managing Finances for a Mobile Lifestyle
- Financial Resilience in Uncertain Times
- Moving Abroad on a Budget:
From Your Family Finances