
The U.S. Bureau of Labor Statistics (BLS) released its employment / unemployment report for October on November 3rd, 2023.
Unadjusted U3 Unemployment Unchanged
![]()
- Adjusted U-3 was 3.9% up from 3.8% in September
- Unadjusted U-3 was 3.6% unchanged
- Unadjusted U-6 was 6.8% up from 6.7%
- Labor Force Participation was 62.7% down from 62.8% in September
- Unadjusted Employment rose from 156.918 to 157.984 million
Summary:
Total Employed increased in October, Unemployment was little changed, and Labor Force Participation was down slightly.
According to the Commissioner of the U.S. Bureau of Labor Statistics:
“Total nonfarm payroll employment increased by 150,000 in October, and the unemployment rate
changed little at 3.9 percent, the U.S. Bureau of Labor Statistics reported today. Job gains
occurred in health care, government, and social assistance. Employment declined in manufacturing
due to strike activity…
Among the major worker groups, the unemployment rates for adult men (3.7 percent), adult women
(3.3 percent), teenagers (13.2 percent), Whites (3.5 percent), Blacks (5.8 percent), Asians (3.1
percent), and Hispanics (4.8 percent) showed little change in October.”
You can read the full BLS report here.
As usual, they are talking about “Seasonally Adjusted Jobs”.
Looking at the Unadjusted Establishment Survey report we see…
Originally the BLS reported employment of 157.001 million for September which they adjusted to 156.918 million. So, they subtracted 83,000 jobs for September. They are currently reporting 157.984 million jobs for October which is actually an increase of 983,000 jobs based on their original estimates or an increase of 1,066,000 based on their updated numbers. But despite a supposed million plus new jobs the unemployment rate is virtually unchanged (and LFPR fell)?
BLS Source
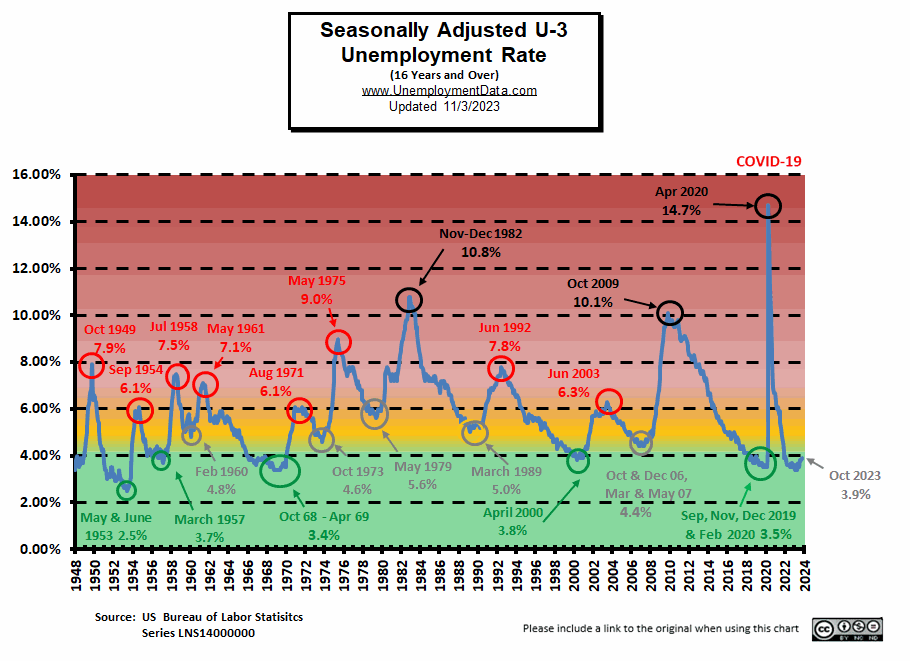
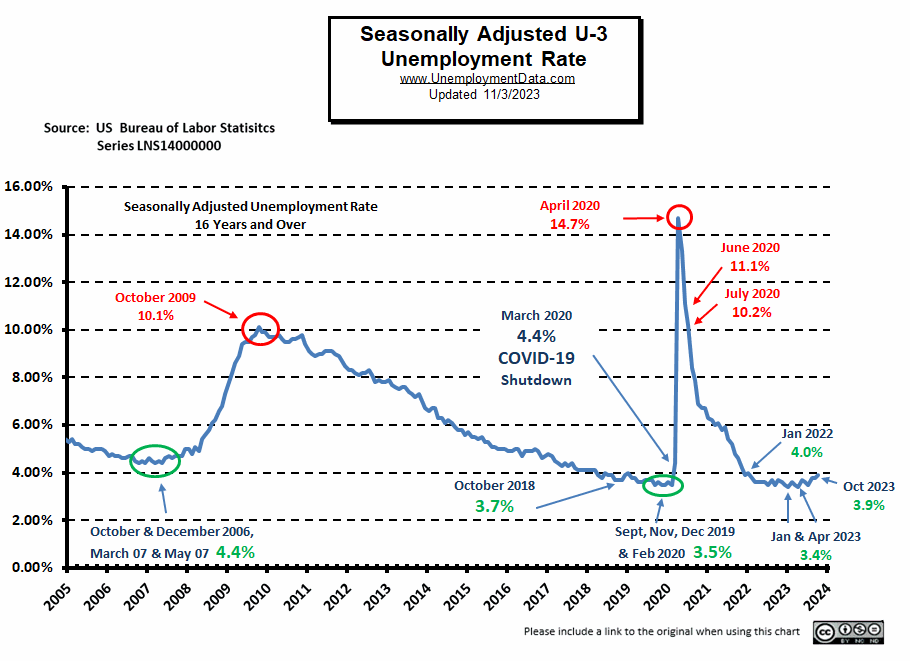
Current Unemployment Rate Chart
Adjusted Unemployment is slightly above the pre-COVID 2019 cyclical lows of 3.5% as well as above the lows made earlier this year. Current levels are still within the “Green Zone”.
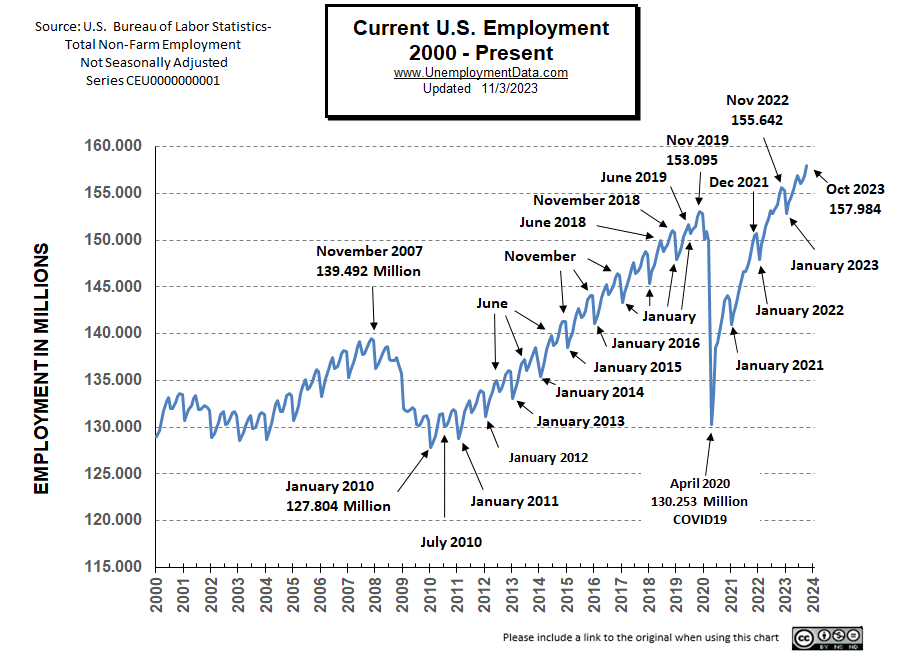
Current Employment Rate
Employment 4.175 million Above Year-Ago Levels
and 7.016 million above February 2020 (prior to the Covid Crash)
However, the Civilian Population has increased by about 8.018 million since February 2020.
Up for the month, at 157.984 million, October Employment is above the November 2022 peak employment level of 155.642 million.
 See Current Employment for more information.
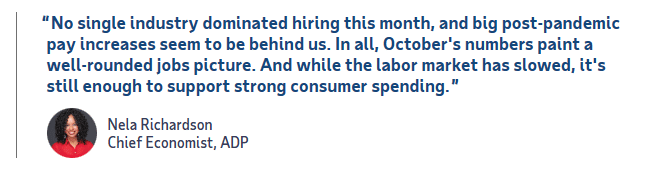
ADP® National Employment Report
ADP provides an independent (non-government) estimate of private-sector employment and pay, based on data derived from ADP client payrolls. According to ADP®, In collaboration with Stanford Digital Economy Lab.
ADP: Private employers added 113,000 jobs in October.
- Leisure and hospitality hiring led the post-pandemic job recovery. But the industry ceded its place as the top job creator last month to education and health care.
Source: ADP® Pay Insights
ADP Private Employment by Firm Size
ADP also lists increases by “firm size”.
This month, net job losses in some firms were countered by gains in others.
October ADP Changes:
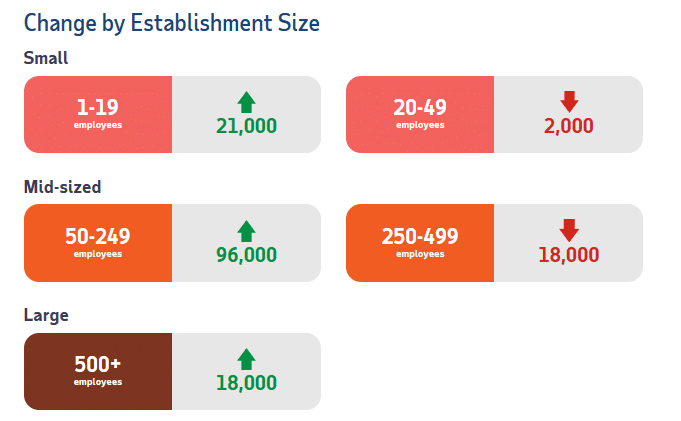
ADP Job Gainers
According to ADP, seven sectors gained employees in October.
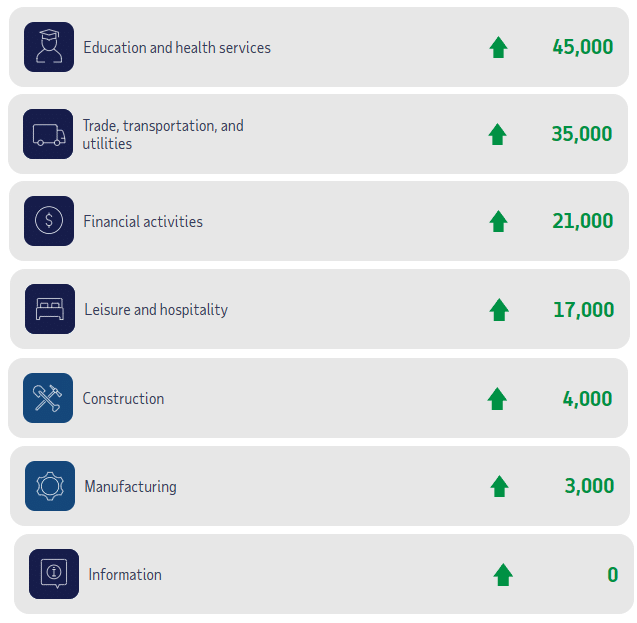
ADP Job Losers

BLS: October 2023 Employment by Sector
The BLS employment “bubble chart” gives us a slightly different picture than the ADP does. The Bubble’s Size tells us the total Employment for that industry (i.e., larger bubbles mean more people are employed in that sector).
The bubble’s location on the chart tells us that there has been a change in Employment Levels over the most recent month… A bubble further to the right indicates larger job growth. A bubble’s vertical location on the chart shows the average industry salary.
Remember, these are Seasonally Adjusted Numbers, so they aren’t cumulative!
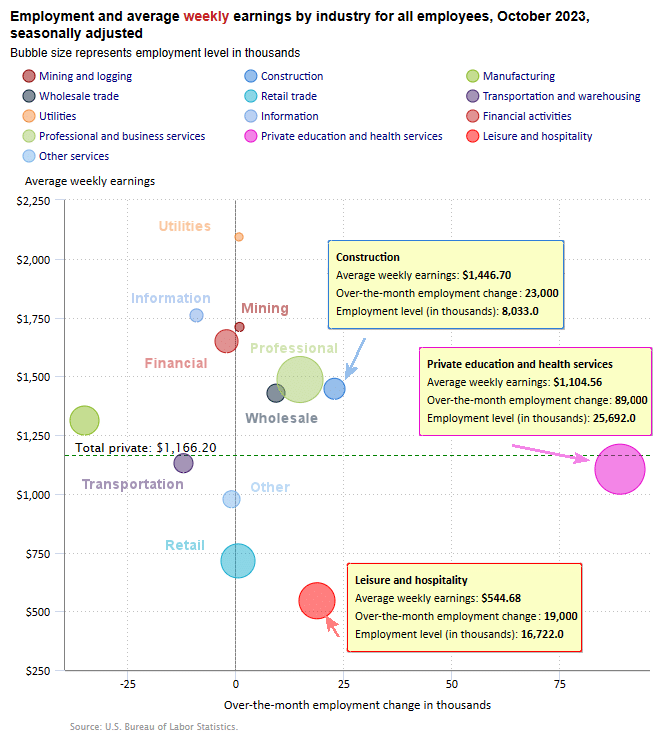
This month ADP and the BLS are nowhere near close in regards to Leisure and Hospitality with 17,000 and 89,000 jobs gained respectively. And ADP says, Professional and Business Services lost 10,000 workers while the BLS is saying they gained 15,000 jobs.
BLS Average Weekly Wages
| Date | Average Weekly Wage |
| October 2023 | $1,166.20 |
| September 2023 | $1,165.47 |
| August 2023 | $1,163.41 |
| July 2023 | $1,157.28 |
| June 2023 | $1,155.15 |
| May 2023 | $1,146.99 |
| April 2023 | $1,147.58 |
| March 2023 | $1,141.34 |
| February 2023 | $1,141.61 |
| January 2023 | $1,146.14 |
| December 2022 | $1,125.73 |
| November 2022 | $1,129.01 |
| October 2022 | $1,124.01 |
| September 2022 | $1,119.87 |
| August 2022 | $1,116.42 |
| July 2022 | $1,116.54 |
| June 2022 | $1,106.76 |
| May 2022 | $1,105.47 |
| April 2022 | $1,102.01 |
| December 2021 | $1,086.46 |
BLS Employment and Average Weekly Earnings by Industry
October 2023, Seasonally Adjusted Employment
Note: A major factor in the unemployment in the Manufacturing sector was the Auto Workers strike.
We’ve added a column to the table below showing the employment levels the BLS reported the previous month. Note that due to “seasonal adjusting,” although they may claim that there was a “monthly increase” (or decrease), there isn’t always an actual increase; you can’t just subtract last month’s “employment level” from this month’s level. For instance, Construction was supposed to have 8,014,000 employees in September and have a 23,000 increase, but in October, there were 8,033,000 employed. That looks like a 19,000 increase, to me. And Retail was supposed to have gained 700 workers but actually has 12,000 fewer workers.
| Industry | October Monthly Increase | Oct. Ave. Weekly Earnings | Oct. Employment Level | Sep. Employment Level |
| Total Private Employment | 99,000 | $1,166.20 | 134,031,000 | 134,012,000 |
| Mining and Logging | 1,000 | $1,709.69 | 646,000 | 645,000 |
| Construction | 23,000 | $1,446.70 | 8,033,000 | 8,014,000 |
| Manufacturing | -35,000 | $1,311.60 | 12,960,000 | 13,011,000 |
| Wholesale trade | 9,400 | $1,427.97 | 6,090,700 | 6,074,500 |
| Retail trade | 700 | $714.29 | 15,546,100 | 15,558,100 |
| Transportation and Warehousing | -12,100 | $1,129.96 | 6,686,200 | 6,702,400 |
| Utilities | 800 | $2,092.92 | 560,700 | 563,200 |
| Information | -9,000 | $1,758.85 | 3,027,000 | 3,036,000 |
| Financial Activities | -2,000 | $1,649.03 | 9,153,000 | 9,157,000 |
| Professional and Business Services | 15,000 | $1,486.12 | 23,027,000 | 23,019,000 |
| Private Education and Health Services | 89,000 | $1,104.56 | 25,692,000 | 25,587,000 |
| Leisure and Hospitality | 19,000 | $544.68 | 16,722,000 | 16,761,000 |
| Other Services | -1,000 | $976.63 | 5,887,000 | 5,884,000 |
Source: BLS
Note: As usual, ADP presents an entirely different picture. See Above.
Unemployment
October’s Seasonally Adjusted Unemployment is 3.9% up from 3.8% in August & September.
 October’s Labor Force Participation Rate
The LFPR is 62.7% down from 62.8%.
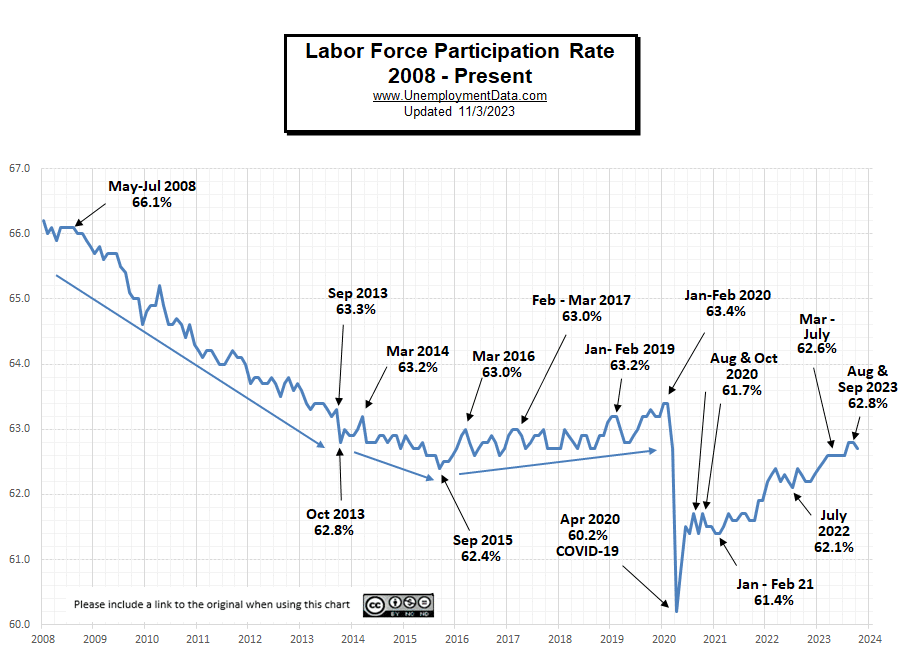 See Labor Force Participation Rate for more information.
Leaving Full Employment?
This chart compares employment levels with the (inverted) unemployment rate.
Full Employment is when everyone who wants a job has one. It is generally considered to be around 3%. After the unemployment rate almost touched the magic full employment line in April, it began moving away (i.e., higher unemployment).
Note: The Unemployment rate is inverted to track the employment rate. Neither is Seasonally Adjusted. For more information see Employment vs. Unemployment.
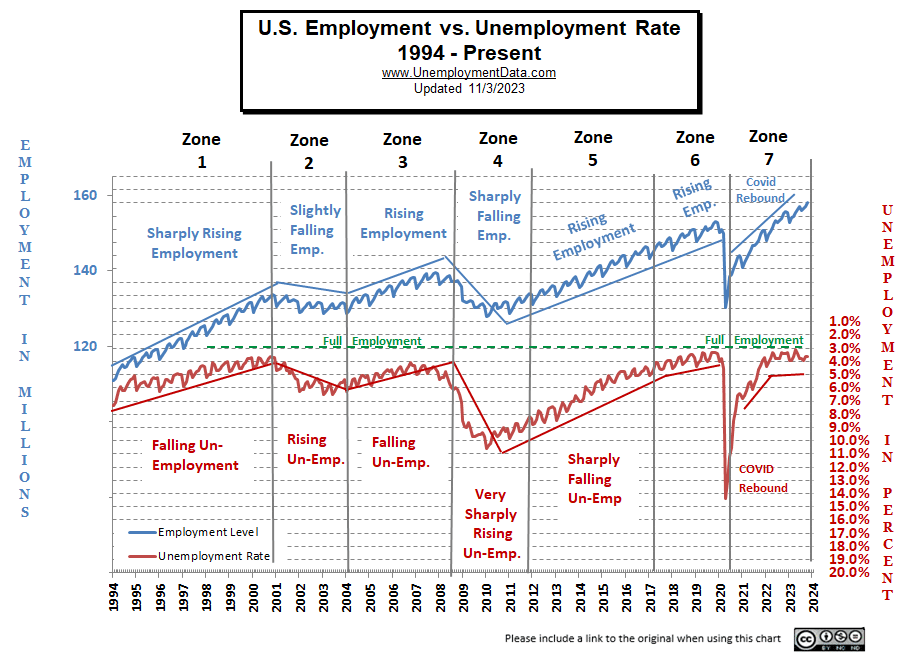
Full employment is not considered to be at zero percent because even when employers are having difficulty finding employees, some people are still unemployed due to either structural unemployment (mismatch between worker skills and job requirements, i.e., not enough training) or simply because they quit their job knowing it would be easy to find another (hopefully better) job. Often referred to as frictional unemployment (there will always be people who have quit or have lost a seasonal job and are in the process of getting a new job). See: Highly Skilled Worker Shortage in a Recession?
If the unemployment rate stays constant, but more people are working, where are these extra workers coming from?
Somehow the workforce has to be growing to accommodate these newly created jobs. They could be long-term unemployed (no longer counted in the workforce) returning to the workforce, they could be immigrants entering the workforce, or possibly retired people coming out of retirement because of an offer too good to turn down. This is generally facilitated by rising wages, but this month’s ADP report indicates that wage growth has slowed, possibly indicating that we are nearing the end of this boom.
Seasonally Adjusted U1 through U6 Unemployment Rates
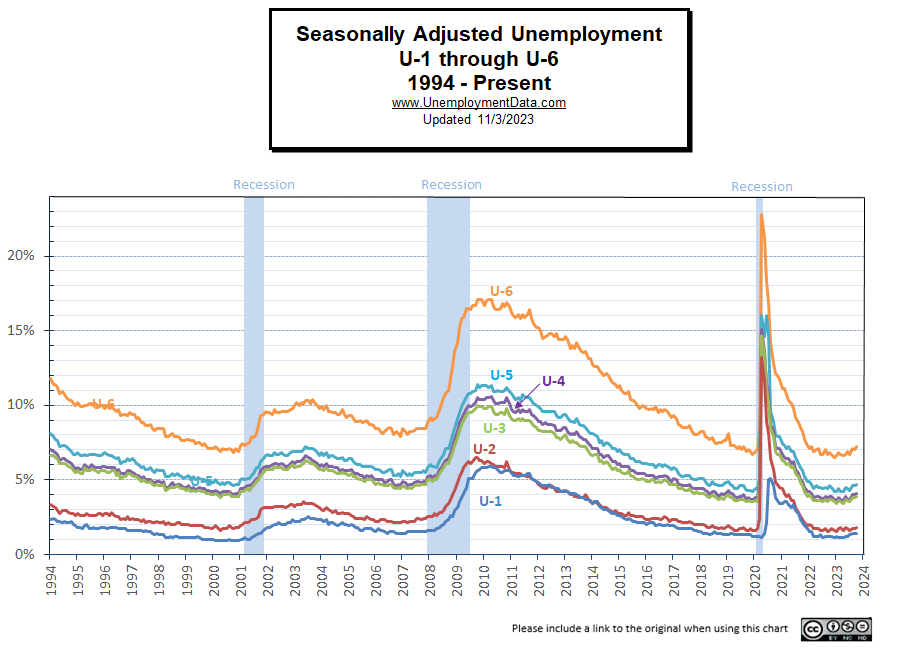 For more information about the various measurements of unemployment, see What Is U-6 Unemployment?
Seasonally Adjusted Unemployment by Education
For the last several months in a row, unemployment by the less educated has been rising. Possibly indicating a tightening job market.
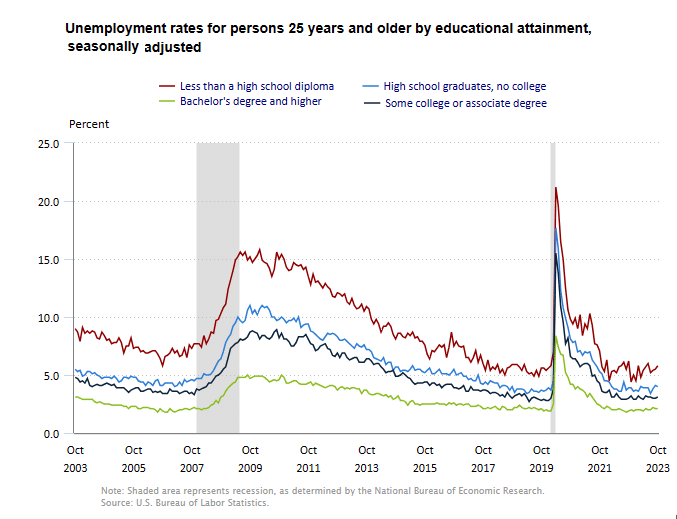 Source: BLS
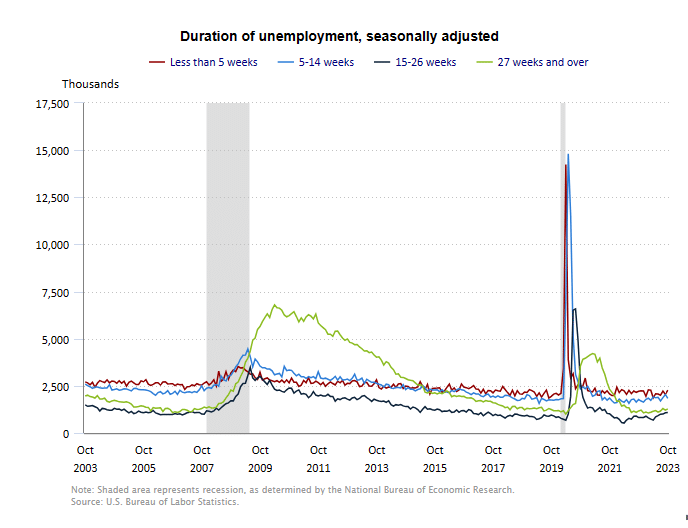
Duration of Unemployment
15-26 week unemployment continues to increase indicating that it is taking longer to find a new job.
Employment-Population Ratio
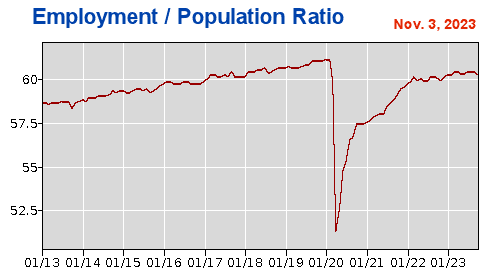
The Employment / Population ratio fell from 60.4% of the population employed in September to 60.2% in October.
See Employment Population Ratio for more information.
Read more on UnemploymentData.com.
- 5 Powerful Ways to Find Your Next Job Online
- Signs of a Great (and Not So Great) Staffing Agency
- Understanding the Rules of Workers’ Compensation Benefits – What You Can and Cannot Do
- Getting Hired: Tips for Finding Work as a Recent College Graduate
From InflationData.com
- The Great Phony Disinflation
- How Germany is Fudging Their Inflation Numbers
- Increasing Inflation Now Shifting Insurance Rates
- Can the FED Engineer a “Soft Landing”?
- Inflation Is a Huge Wealth Redistribution Scheme
- When Can We Expect Lower FED Rates?
From Financial Trend Forecaster
- Moore Inflation Predictor
- NYSE ROC
- NASDAQ ROC
- Bidenomics: Boom or Bust?
- Could a Hamas vs. Israel War Trigger a Worldwide Recession?
- The Dangerous Myth of a “Soft Landing”
- The Crux of China’s Problems
- Will a New BRICS Currency Dethrone the U.S. Dollar?
- The European Energy Crisis May Be Back Soon
- What Made Maui’s Lahaina Fire So Deadly?
- Which is Worse- Easy Money or Public Debt?
- Mini-Manias: Beware Short-Term Trading Frenzies – Like This One
- Why You Should Expect a Once-in-a-Lifetime Debt Crisis
- Why Do Traders Really Lose Money?
- Quick Takes on Big Financial Trends
- Extremely Rare Market Signal Just Triggered
From OptioMoney.com
- Moving Abroad on a Budget:
- Give Your Brand the Refresh It Deserves
- DIY vs. Professional Movers
- 7 Ways to Increase the Value of Your Home
- Is a Home Warranty a Good Investment?
From Your Family Finances