
Back in February of 2016 Fortune magazine published an article entitled “The U.S. Economy Is Finally at Full Employment” and then in May CNN-Money published an article entitled The U.S. is ‘basically at full employment’ quoting San Francisco Federal Reserve President John Williams as saying “We’re basically at full employment…that’s very good news.”
“We’re basically at full employment…that’s very good news.” San Francisco Federal Reserve President John Williams
So what is “Full-Employment” and are we really there? At first glance you might think that full employment should equal 0% and with the current unemployment rate hovering around 4.7% we obviously aren’t there. But Full employment, in macroeconomics, is defined by many economists as being an acceptable level of unemployment somewhere above 0%.
Even when employers are having difficulty finding employees some people are unemployed simply because they quit their job knowing it would be easy to find another (hopefully better) job. Often referred to as frictional unemployment (there will always be people who have quit or have lost a seasonal job and are in the process of getting a new job) and structural unemployment (mismatch between worker skills and job requirements). See: Highly Skilled Worker Shortage in a Recession?
The 20th century British economist William Beveridge stated that an unemployment rate of 3% was full employment. More recently economists have tried to raise the definition of “full employment even higher. For instance, in the U.S. William Dickens estimated that full-employment unemployment rate varied a lot over time but equaled about 5.5 percent of the civilian labor force during the 2000s.
In the chart below we can see that the U-3 bottomed around 4% in both 2001 and 2007. We have to keep in mind that prior to modern day Welfare programs you either worked or you starved. So people were more motivated to find jobs, but as assistance programs like food stamps, unemployment insurance, and welfare increases, the motivation to take low-paying jobs decreases. So “full-employment” results at a higher rate than without these programs. With 9.1% of the population “marginally attached” to the workforce and as many as another 10% having dropped out of the workforce altogether I find it hard to believe that we are anywhere near full employment.
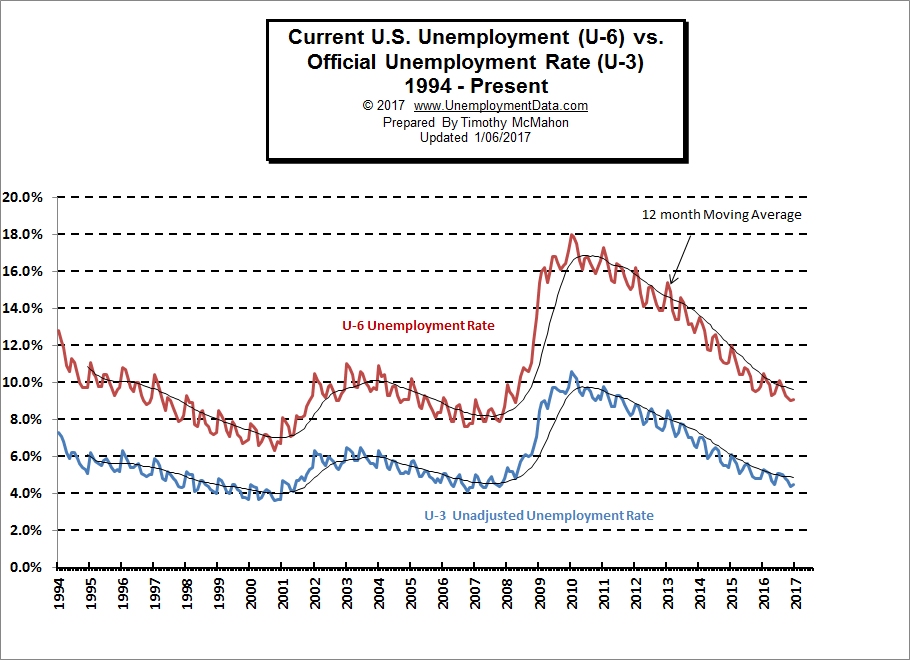
If we compare U-6 to U-3 we can get a better picture of where full employment really is. Remember, according to the BLS, the difference between U-6 and U-3 is that U-6 includes “discouraged workers”, or those who have stopped looking for work because current economic conditions make them believe that no work is available for them. Also part-time workers who want to work full-time, but cannot i.e. the economy is bad so their employer cut their hours and they can’t find other work. Also “under-employed” workers.
How many college educated people are working at McDonalds, Walmart and Starbucks?
All of these people are still in the workforce and so in order to really be at “full employment” we need to find jobs for these people. And not just any jobs but good jobs using their skills and abilities to their full potential. So I suggest that the solution is to look at the difference between U-6 and U-3 i.e. U6 minus U-3. As U-6 approaches U-3, it means that the marginally attached workforce is shrinking. So logically, when the difference between U-6 and U-3 approaches zero the economy should be approaching full employment. In the 2000’s there were only two periods when the economy got within 3+% of this ideal and never when it actually approached zero. So aren’t economists simply lowering the bar to make it look like we are nearing full employment?
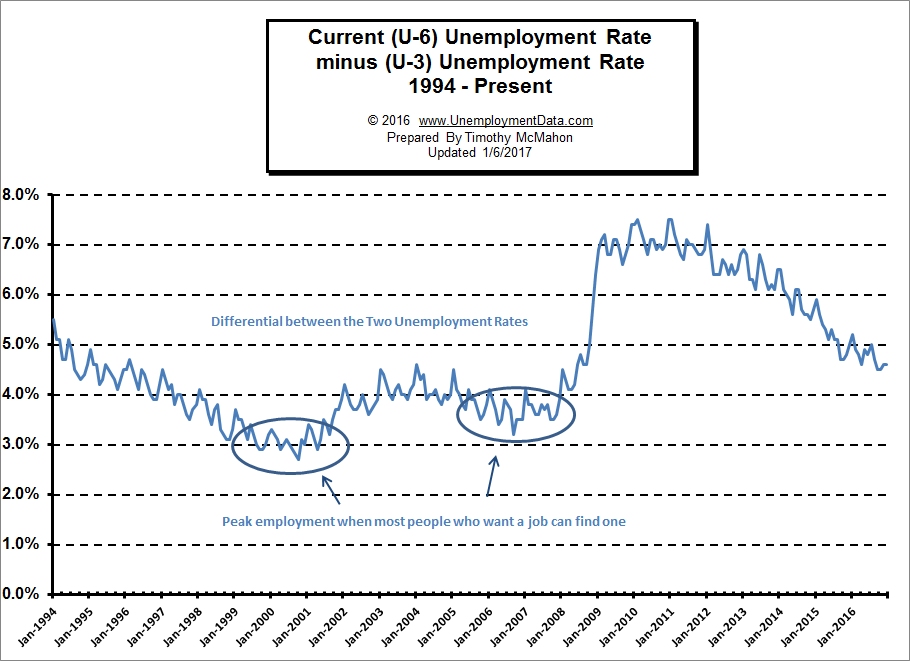
In the chart above we can see that in late 2000 and again in late 2006 the differential between these two got into the 3% range meaning that the economy was so good enough that it lured many of these marginally attached individuals back into the workforce. In other words, employers were competing for employees and offering higher wages and benefits making it more beneficial to work than to sit home on unemployment (or welfare).
If we use this as the indicator of full employment we can see from the chart above that we are nowhere near full employment… as we are just entering the worst of the zone between 2002 and 2005 and are not even near the two circled zones. And certainly nowhere near a zero percent differential.
The big lie perpetrated by a falling LFPR
As the LFPR falls (bad) it appears that the unemployment rate is falling (good). So even though the ranks of the unemployed stays the same (or even grows) the numbers look like things are getting better. Apparently even the FED and Economists fall for the lie. See also What is the Labor Force Participation Rate?