• About WordPress
    • WordPress.org
    • Documentation
    • Learn WordPress
    • Support
    • Feedback
  • Log In
  • Skip to primary navigation
  • Skip to main content
  • Skip to primary sidebar
  • Home
  • Contact us
  • Related Sites
    • InflationData.com
    • Financial Trend Forecaster
    • Your Family Finances
    • Elliott Wave University
    • Optio Money
  • About
    • Terms of Use
    • Disclaimer & Disclosure
    • Privacy Statement
  • Sitemap
    • 2009-2010 Posts
    • 2011 Posts

UnemploymentData.com

Your Source for Employment and Unemployment Data

Unemployment
  • Charts
    • Current Unemployment Rate Chart
    • Current Employment Rate (Chart and Data)
    • Current Employment vs Unemployment Chart
    • Historical Employment Data
    • Employment Population Ratio
    • Misery Index
  • Unemployment
    • Historical Unemployment Rate Tables
    • What Is U-6 Unemployment?
    • Unadjusted vs. Seasonally Adjusted U-3 Unemployment Rate
    • BLS vs. Gallup Unemployment Numbers
    • Current U-6 Unemployment Rate
    • What is the Labor Force Participation Rate?
    • What is the Real Unemployment Rate?
  • Employment
    • Current Employment Rate (Chart and Data)
    • Historical Employment Data
    • Contacting a Live Person at the State Employment Commission
      • How to Talk to a Live Person at the Virginia Unemployment Commission
      • Florida’s FLUID Unemployment Program
    • Benefits
      • Insurance
      • Retirement
    • Careers
    • Employment Costs
    • Experience
    • Government
    • Job Hunting
      • Interview
      • Resume
  • Find Articles
  • Education
    • Skills
  • General
    • Small Business
      • Outsourcing
    • Success
You are here: Home / Unemployment / A Closer Look at All Those New U.S. Jobs

A Closer Look at All Those New U.S. Jobs

November 12, 2015 by Elliott Wave International

U.S. labor force participation rate is at its lowest level in 38 years

A Closer Look at All Those New U.S. Jobs
U.S. labor force participation rate is at its lowest level in 38 years

By Elliott Wave International

Editor’s note: You’ll find a text version of the story below the video.

I was in the café of a bookstore recently and overheard a young man tell his friend, “It’s hard to get a job these days, even with a degree.”

Of course, this was just one comment, and anecdotes are not a substitute for statistics.

But much of the talk about the U.S. job market is that it’s far less robust than it use to be, despite a steady improvement in the official jobless rate since the Great Recession high of 10.0% in October 2009. This October, the official unemployment rate was 5%.

In truth, the real jobless rate would be 9.8% if those who have given up looking for work and part-timers who want a full-time job were included.

The labor force participation rate is at its lowest level in 38 years.

This Federal Reserve chart (November 6) shows that only 62.4% of working-age Americans are employed or looking for work:

Fedcivilianlaborforceparticipation

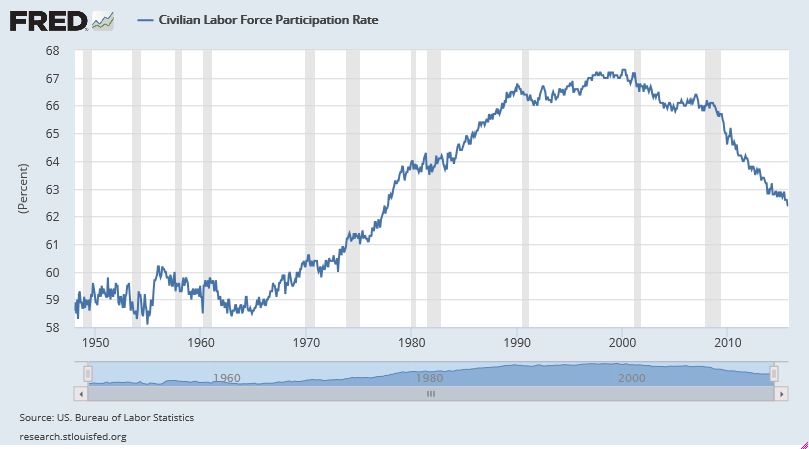
A record 94,610,000 Americans were not in the workforce in September. But the questionable health of the U.S. labor market doesn’t stop here.

Even those who are working are struggling to make headway. This chart and commentary from our October Elliott Wave Financial Forecast explains:

The mean measure of U.S. personal income peaked in 2006. The median measure shows that half of U.S. citizens are earning less money in real terms than they were in 2000. The five-wave form of the rise in mean income is further Elliott wave evidence that the decline is about to accelerate.

And what about the 2.95 million new jobs that were created in 2014, and the slightly more than 2 million so far in 2015?

The numbers sound impressive until you dig deeper. This is from the Atlantic magazine (September 4):

According to new research, between 2009 and 2014, wage loss across all jobs averaged 4 percent. But for those in the bottom quintile, those losses averaged 5.7 percent. … The [jobs] where declines in real wages have been the most acute — are also the jobs that have hired the highest share of new workers during the recovery.

It’s true that average hourly earnings increased by nine cents in October. Even so, the point is that many of the new jobs in the U.S. have been at the lower end of the income brackets.

Also consider that in September, the U.S. Consumer Price Index fell 0.2% and that the Producer Price Index declined by 0.5%.

All told, our stance remains that deflation is knocking at the door.

Get the full picture of what we see as a worldwide deflationary trend in our new report, Deflation and the Devaluation Derby.

Here’s what you will learn:

  • Currency devaluation’s role in the developing global crisis
  • How the self-reinforcing aspect of deflation is already apparent in commodities trading
  • Why the top 1% of earners are in for a rude awakening
  • How Europe’s biggest economies are screeching to a halt
  • The hair-raising future for U.S. stocks

Just recall how swiftly the 2007-2009 financial crisis unfolded. We anticipate that the next global financial crisis could be even more sudden and severe.

Prepare now with our new report, Deflation and the Devaluation Derby. CLICK TO CONTINUE READING >>


Filed Under: Unemployment

Primary Sidebar

Search Site

Sponsored:

URGENT: These Stocks Stand Poised to Benefit from President Trump's Trade Wars!

As the Trump administration moves ahead with aggressive tariff policies on key imports, the mainstream media is scrambling.

This Free Report - which you can download now - reveals the names and ticker symbols of 5 Stock Poised to Benefit Most from President Trump's Tariff Wars.

Click Here to Download Your FREE Stock Report Now.

Recent Posts

  • April 2025 Employment / Unemployment Report
  • Would More Jobs Help Social Security?
  • March 2025- Employment / Unemployment Report
  • February 2025 Jobs Report
  • January 2025 BLS Employment Report

Resources

  • Bureau of Labor Statistics Current Population Survey Monthly survey of households conducted by the Bureau of Census for BLS. It provides data on the labor force, employment, unemployment, etc.
  • Capital Professional Services Providing web design and development and Internet marketing services
  • Elliott Wave University Using the Elliott Wave Principle to improve investment performance
  • Financial Trend Forecaster Featuring Moore Inflation Predictor, NYSE Rate of Change and NASDAQ Rate of change
  • InflationData.com Inflation calculators, databases, etc.
  • Intergalactic Web Designers Web design and development services
  • Your Family Finances

Articles by Category

Articles by Date

Disclaimer

At UnemploymentData.com we are not registered investment advisors and do not provide any individualized advice. Past performance is not necessarily indicative of future performance and future accuracy and profitable results cannot be guaranteed.

Privacy & Terms of Use

Privacy Statement & Terms of Use

Do Not Sell My Information

Copyright © 2025 · News Pro on Capital Professional Services, LLC. All rights reserved · Log in