
Bureau of Labor Statistics Unemployment Data:
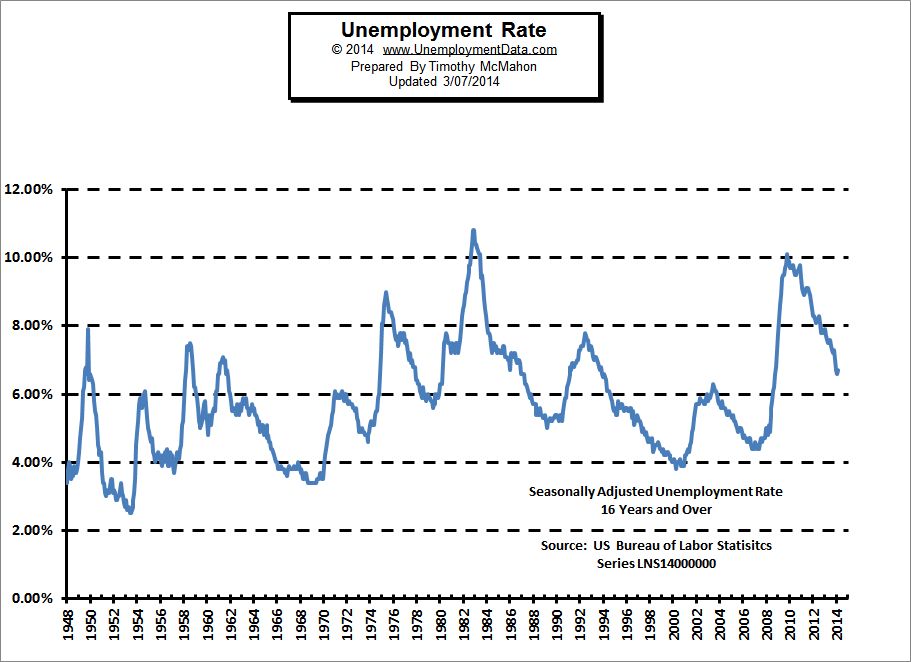
The U.S. Bureau of Labor Statistics (BLS) released the Unemployment numbers today. According to the government agency the current “Seasonally Adjusted Unemployment rate is 6.7% up slightly from January’s 6.6%. The unadjusted unemployment rate was unchanged at 7%. The broadest measure of unemployment which includes discouraged workers called U-6 was at 13.1% down from 13.5% last month.
Gallup Unemployment Data:
Amid concern about the reliability of the BLS numbers, four years ago, Gallup Poles decided to begin tracking unemployment numbers themselves. So we have an alternative to the Government numbers. According to Gallup the adjusted unemployment rate is 7.6% and the Unadjusted unemployment rate is 8.0%. But the real difference comes with the U-6 which Gallup calls the “Underemployment rate” at 17.5% it is a full 4.4% higher than the government sanctioned numbers.
See: Current US Unemployment Rate for full article.
Current Employment Data:
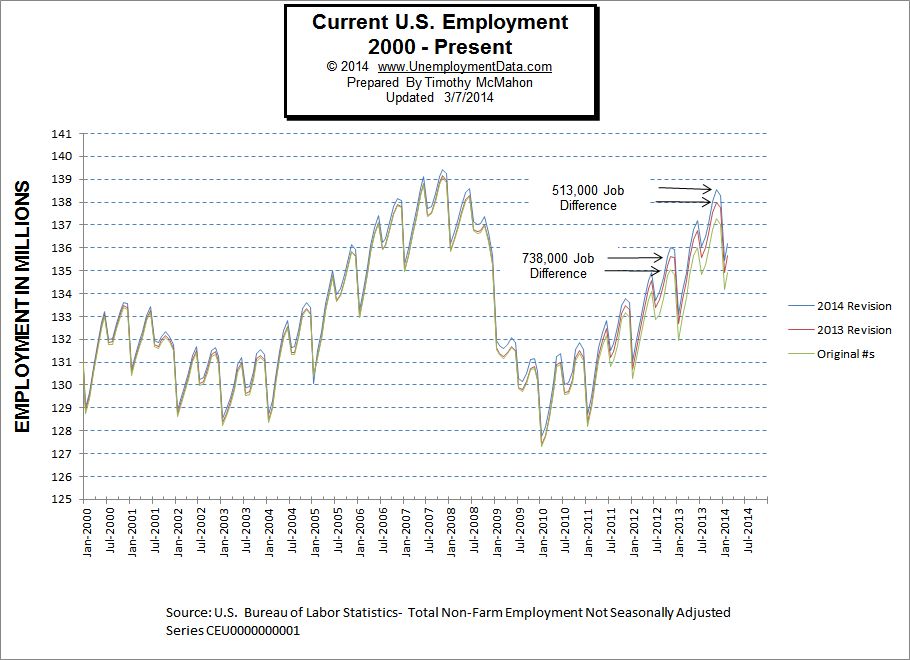 Employment numbers for February ticked up a bit from January’s low numbers. According to the BLS there were 136.183 million jobs in February an increase of 750,000 over January.
See the full article on current employment levels.
Employment vs. Unemployment
When looking at employment and unemployment you would think that they would simply be the inverse of each other. Flip one over and you have the other. But it isn’t quite that simple. The BLS actually uses two entirely different methodologies to calculate them unemployment is calculated through the Current Population Survey where 15,000 households are contacted and asked about their employment status. This is called the “Current Population Survey”.
The employment rate is based on reports filed by 390,000 businesses every month. This is called the Current Employment Statistics (CES). Read our full report on how the current employment and unemployment rate compares.
Historical Employment Data and Recessions
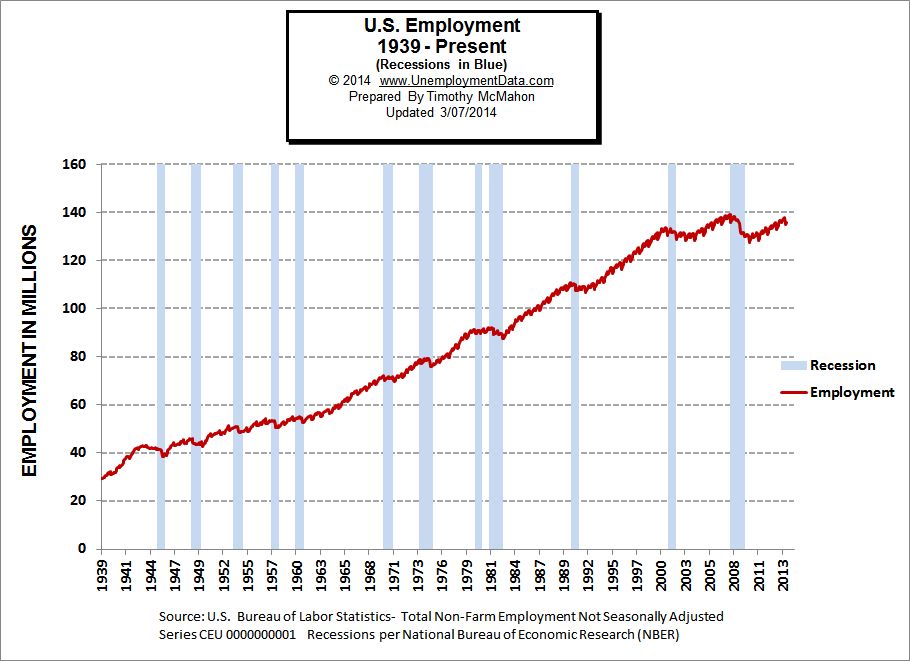 The government began tracking the employment rate at the end of the “Great Depression” in 1939. Since that time we have had twelve official “recessions” based on the official description of a “recession” by the National Bureau of Economic Research (NBER). The NBER does not define a recession in terms of two consecutive quarters of decline in real GDP as some organizations do. Instead, they define a recession as “a significant decline in economic activity spread across the economy, lasting more than a few months, normally visible in real GDP, real income, employment, industrial production, and wholesale-retail sales”.
So since part of the definition is a decline in employment you would expect that high levels of unemployment would correspond with times of recession. Read more about the Historical employment data and recessions.
The Misery Index
The misery index is a combination of the inflation and unemployment rates. The theory is that rapidly rising prices combined with high levels of unemployment will create a “double whammy” and create the maximum level of misery for consumers. See: InflationData’s Misery Index.
What is U-6 Unemployment?
As mentioned above U-6 is the broadest measure of Unemployment with measurements ranging from U-1 through U-6. U-6 includes those who have given up looking for work and those who are working part-time but would prefer to work full-time. For more information on U-6 see: What is the Real Unemployment Rate? and Current U-6 Unemployment Rate.
Seasonally Adjusted vs. Non-adjusted Unemployment Rates:
The commonly quoted “unemployment rate” is the “Seasonally adjusted” U-3 unemployment rate. But why is it adjusted? How does the adjustment affect the numbers? See Seasonally Adjusted Unemployment vs. Non-adjusted for full discussion and charts on how they compare.
See Also: