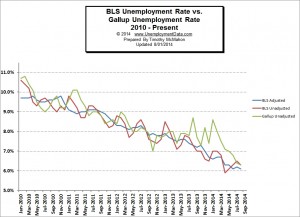
The U.S. Bureau of Labor Statistics (BLS) released the August Unemployment figures on September 5th. The Seasonally Adjusted Unemployment Rate was 6.2% up from 6.1% in June. The Unadjusted Unemployment rate was also down from 6.5% in July to 6.3% in August.
 In another rare occurrence, the BLS seasonally adjusted numbers are actually identical to the Gallup numbers for the first time since September 2011. In the interim the BLS has been lower than the Gallup numbers 24 times and Gallup has been lower 9 times. The average difference when the BLS is lower is 0.6% but when Gallup is lower the average has only been 0.3%. So in addition to BLS being lower more often it is also lower by more indicating some sort of bias to the downside. But perhaps the BLS is mending their ways since last month and this month have resulted in the BLS and Gallup being well within a normal margin of error.
According to the commissioner of the Bureau of Labor Statistics monthly report, “Total nonfarm payroll employment increased by 142,000 in August, and the unemployment rate was little changed at 6.1 percent… In August, both the unemployment rate (6.1 percent) and the number of unemployed persons (9.6 million) changed little. Over the year, the unemployment rate and the number of unemployed persons were down by 1.1 percentage points and 1.7 million, respectively.”
On an unadjusted basis the employment numbers look even better with employment up 2.5 million and unemployment was down from 7.3% in August 2013 to 6.3% in August 2014.
The BLS says the broader U-6 unemployment fell from 12.6% in July to 12.0% in August while Gallup says that it is actually 15.1% a difference of 2.5% or a 20.8% margin of error. Many people consider the U-6 unemployment rate to be the “real” unemployment rate because it includes “discouraged workers” i.e. those who would like to work but have given up looking because they don’t feel there are any jobs available for them. See What is U-6 Unemployment? for more information.
Payroll to Population Rate
The payroll to population rate looks at a slightly different metric than the unemployment rate although at first blush it sounds similar. While the unemployment rate looks at the percentage of the “workforce” that can’t find a job (and a fairly narrow definition of the term workforce at that). Gallup’s Payroll to Population rate (P2P) looks at the percentage of the total population that is working. This number, in my opinion, is much less subject to fudging since although you can redefine the term “workforce” as evidenced by the various unemployment rates (U1 through U-6) it is much more difficult to redefine the total population of the United States.
Unlike the unemployment rate where a lower number is better, in the P2P, a higher number is better in that it indicates a greater percentage of the population is working. In August, Gallup’s P2P was 44.9% down from July’s 45.1% and June’s 45.0%.
See Also:
