
Unemployment rates vary drastically by state depending on local conditions and a state’s individual legislative policies. As a general rule those states with a “pro-business” stance have lower unemployment rates than those who punish businesses through high taxation and miles of “red-tape”.
Currently, North Dakota has the lowest unemployment rate at 2.6% while Nevada has 7.9%, California has 7.6%, and Michigan and Illinois have 7.5%. While the Southern States of Kentucky and Mississippi have 7.7% unemployment and Georgia has 7.2% but right next door Alabama has 6.8% and South Carolina has 5.3%.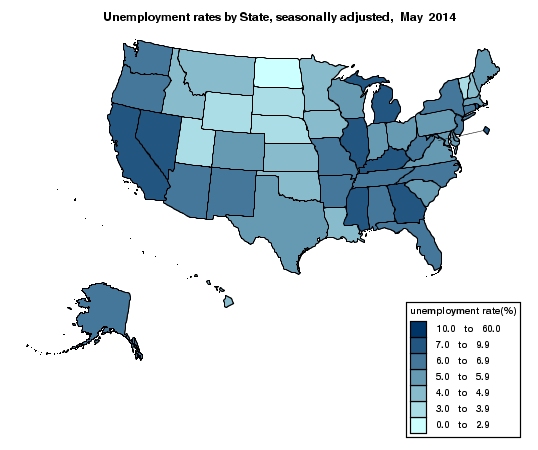 Source U.S. Bureau of Labor Statistics
Stories abound of the abundance of jobs in North Dakota where the shale oil boom is turning everyday Americans into millionaires. People with High School educations are earning over $100,000 per year because of the high demand for labor. Of course along with higher wages, the cost of living especially for food and housing is much higher as well due to the short supply.
Here is a Table of the Unemployment Rate by State:
Map Title: Unemployment rates by State, seasonally adjusted Map Type: state Map Month/Year: May/2014 |
|||
| State | May 2014 |
||
|---|---|---|---|
| Alabama | 6.8 | ||
| Alaska | 6.4 | ||
| Arizona | 6.8 | ||
| Arkansas | 6.4 | ||
| California | 7.6 | ||
| Colorado | 5.8 | ||
| Connecticut | 6.9 | ||
| Delaware | 5.9 | ||
| District of Columbia | 7.5 | ||
| Florida | 6.3 | ||
| Georgia | 7.2 | ||
| Hawaii | 4.4 | ||
| Idaho | 4.9 | ||
| Illinois | 7.5 | ||
| Indiana | 5.7 | ||
| Iowa | 4.4 | ||
| Kansas | 4.8 | ||
| Kentucky | 7.7 | ||
| Louisiana | 4.9 | ||
| Maine | 5.7 | ||
| Maryland | 5.6 | ||
| Massachusetts | 5.6 | ||
| Michigan | 7.5 | ||
| Minnesota | 4.6 | ||
| Mississippi | 7.7 | ||
| Missouri | 6.6 | ||
| Montana | 4.6 | ||
| Nebraska | 3.6 | ||
| Nevada | 7.9 | ||
| New Hampshire | 4.4 | ||
| New Jersey | 6.8 | ||
| New Mexico | 6.5 | ||
| New York | 6.7 | ||
| North Carolina | 6.4 | ||
| North Dakota | 2.6 | ||
| Ohio | 5.5 | ||
| Oklahoma | 4.6 | ||
| Oregon | 6.9 | ||
| Pennsylvania | 5.6 | ||
| Rhode Island | 8.2 | ||
| South Carolina | 5.3 | ||
| South Dakota | 3.8 | ||
| Tennessee | 6.4 | ||
| Texas | 5.1 | ||
| Utah | 3.6 | ||
| Vermont | 3.3 | ||
| Virginia | 5.1 | ||
| Washington | 6.1 | ||
| West Virginia | 6.3 | ||
| Wisconsin | 5.7 | ||
| Wyoming | 3.8 | ||
However, the picture for individual states is not uniform, even some individual counties within a state are better off than adjoining counties. For instance in Nevada:
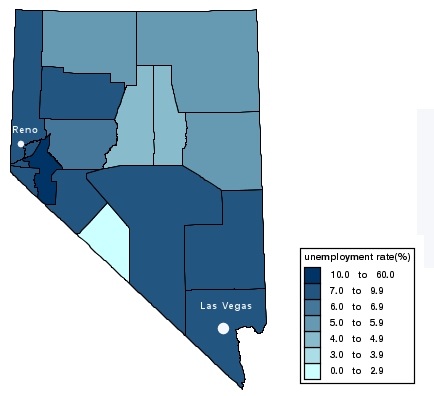
Lyon county near Reno, had about 52,000 people in the 2010 census and from 2000 until 2008, it was one of the fastest growing counties in the United States. However, its growth rate collapsed during 2008 and currently has 10.4% unemployment.
California Unemployment by County:
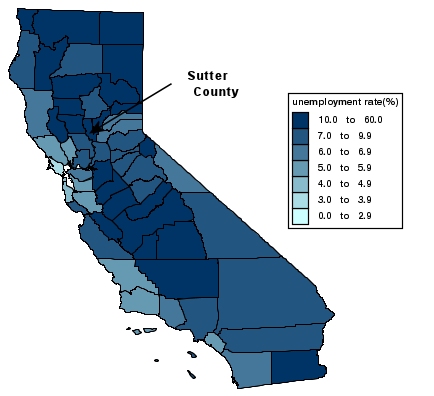
Sutter county had a population of just over 95,000 people in 2013. The county has a total area of 608 square miles with 88% being farmland.
Michigan:
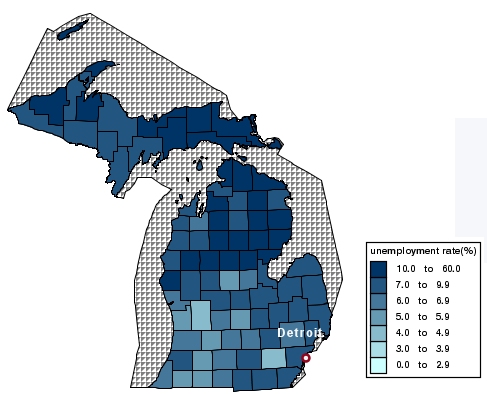
Mackinac County has 17.8% unemployment, while both Cheboygan and Presque Isle Counties have 14.9% unemployment at the other end of the spectrum Kent county has 4.8% unemployment.
Alabama:
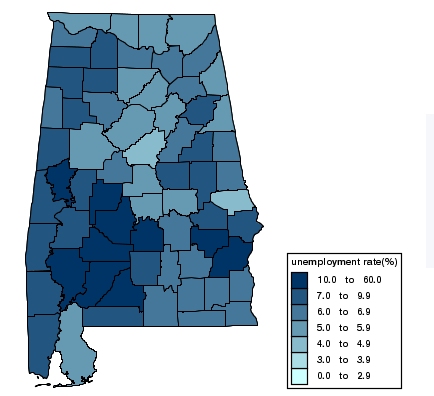
Wilcox county has 15.5% unemployment, Green County has 12.7%, Perry and Monroe Counties have 11.9 and 11.8% respectively but Tuscaloosa and Madison counties have only 5.5% and Cleburne and Cherokee counties have 5.4% and 5.3% respectively.
After looking at all the high unemployment states let’s take a moment to look at the state with the lowest unemployment, North Dakota.
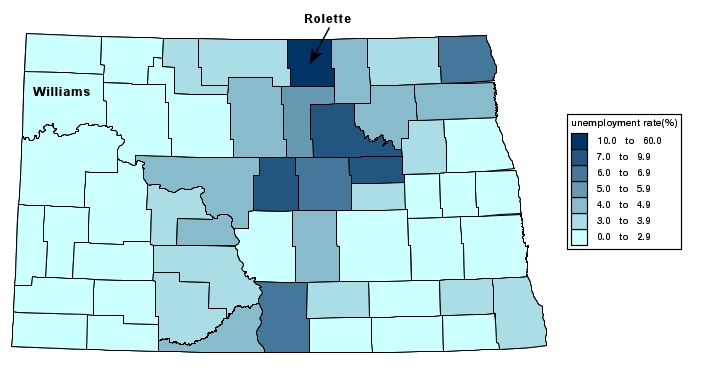
Rolette county is the home of the Turtle Mountain Indian Reservation and has the dubious honor of having the highest unemployment in the state at 11.6% and Williams county the home of Williston (the center of the shale oil boom) has the lowest at 0.9%.
Other low unemployment counties include Dunn at 1.1%, Mountrail and Slope at 1.3%, Billings and McKenzie at 1.4%, and Bowman at 1.5%.