
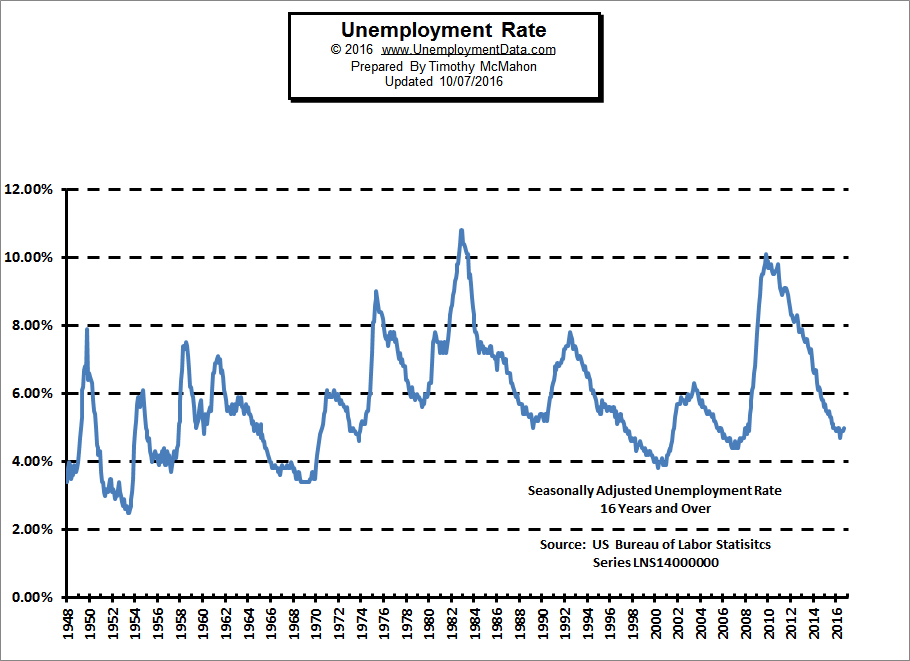
The U.S. Bureau of Labor Statistics (BLS) released the Unemployment numbers for the month of September on Friday, October 7th. The Seasonally Adjusted U-3 Unemployment rate was 5.0% after being 4.9% for three months in a row. The unadjusted U-3 Unemployment rate was 4.8% and Gallup’s equivalent unadjusted rate was 5.3% for a 0.5% difference.
The unadjusted U-6 Unemployment rate which includes “discouraged workers”, “marginally attached workers” and Part time workers who want to work full-time was 9.3% in September down from 9.7% in August while Gallup’s equivalent which they call the “Underemployment rate” was 12.8% down from
13.1% in August. The civilian non-institutional population increased another 237,000 this month bringing it to 254,091,000.
According to the BLS Commissioner’s report for this month:
 “Total nonfarm payroll employment increased by 156,000 in September, and the unemployment rate was little changed at 5.0 percent, the U.S. Bureau of Labor Statistics reported today. Employment gains occurred in professional and business services and in health care…The unemployment rate, at 5.0 percent, and the number of unemployed persons, at 7.9 million, changed little in September. Both measures have shown little movement, on net, since August of last year… Among the major worker groups, the unemployment rate for Hispanics increased to 6.4 percent in September, while the rates for adult men (4.7 percent), adult women (4.4 percent), teenagers (15.8 percent), Whites (4.4 percent), Blacks (8.3 percent), and Asians (3.9 percent) showed little or no change. The number of persons unemployed less than 5 weeks increased by 284,000 to 2.6 million in September. The number of long-term unemployed (those jobless for 27 weeks or more) was essentially unchanged at 2.0 million and accounted for 24.9 percent of the unemployed.”
See Current Unemployment Rate Chart for full commentary.
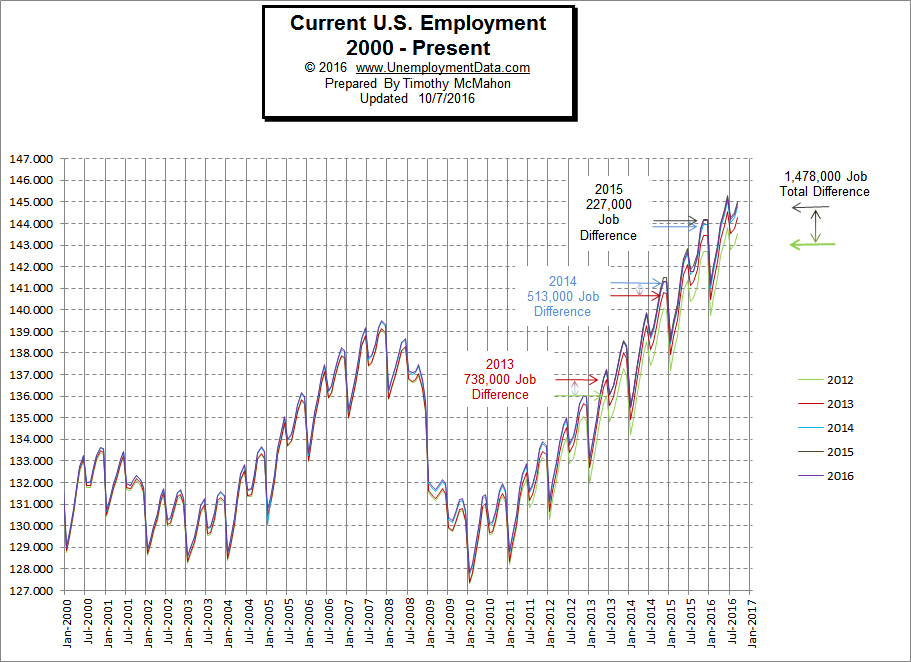 The number of Unadjusted jobs reported for September was 144.943 million up from August’s 144.424 million but still below June’s 145.215 million. Employment is slightly above November 2015’s previous peak of 144.122 million.
According to the BLS, in November 2007 there were 139,443,000 people employed, the unadjusted unemployment rate was 4.5% and the civilian non-institutional population was approximately 232 million. In September of 2016, there were 144,943,000 employed for a net increase of 5.433 million jobs with an unadjusted unemployment rate of 4.8%.
But now there are 254.091 million civilians (not in jail, the military or institutions). So the population has increased by over 22 million. Since almost half of the population is looking for jobs (Gallup says the payroll to population rate has fallen to 45.7%) we would need over 10 million (22 x 0.457) more jobs just to be at the same employment level we were in 2007. But employment only increased by 5.4 million. So we are about 5 million jobs short. But somehow the unemployment rate is roughly the same??? See Current Employment Data for more info.
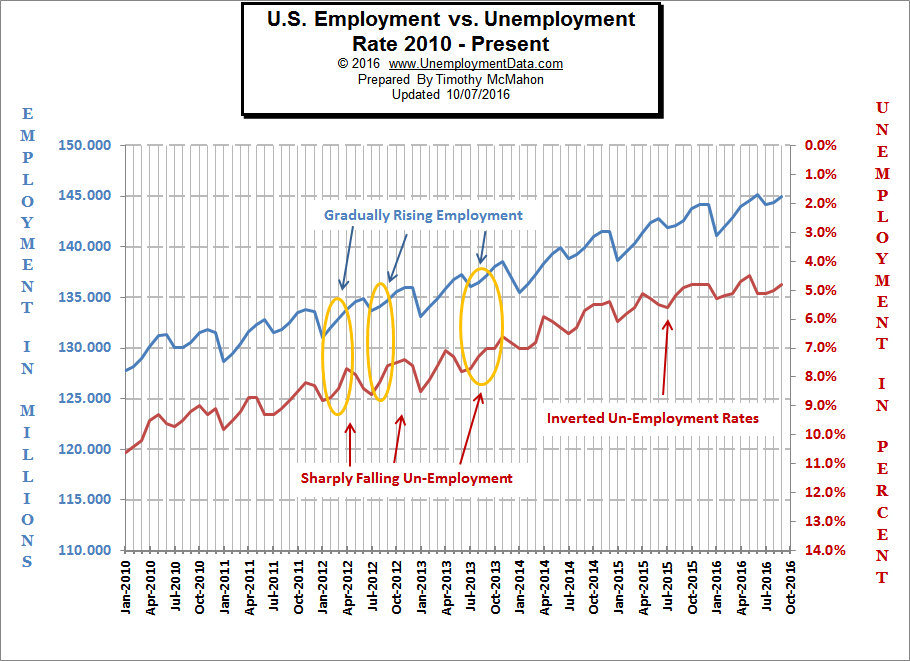 Our Current Employment vs Unemployment Chart compares the Employment rate to the Unemployment rate as reported by the BLS in an effort to get the true employment picture.
From the chart, we can see that there are occasions when they are not exact mirrors of each other.
Although, the recovery officially began in 2011, it took until June of 2014 to exceed the employment levels of November 2007 and by that point the civilian non-institutional population had grown from 232.939 million to 247.814 million (or almost 16 million, now it is up 22 million+).
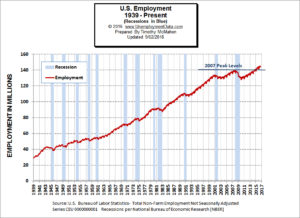
See the Historical Employment Data chart which overlays the employment data on blue bars showing periods of official recessions.
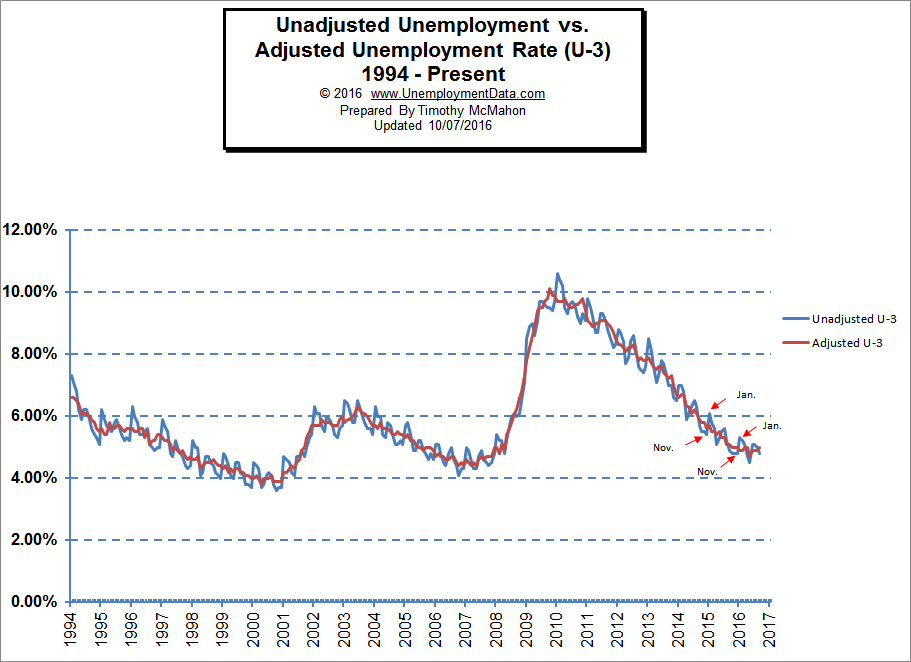
The U.S. Bureau of Labor Statistics (BLS) publishes the U.S. Unemployment Data and promotes the Seasonally Adjusted U-3 Unemployment Rate as the primary measure of unemployment. But often when we look at the adjusted Unemployment rate it is moving in the opposite direction as the unadjusted Unemployment rate. Compare them here.
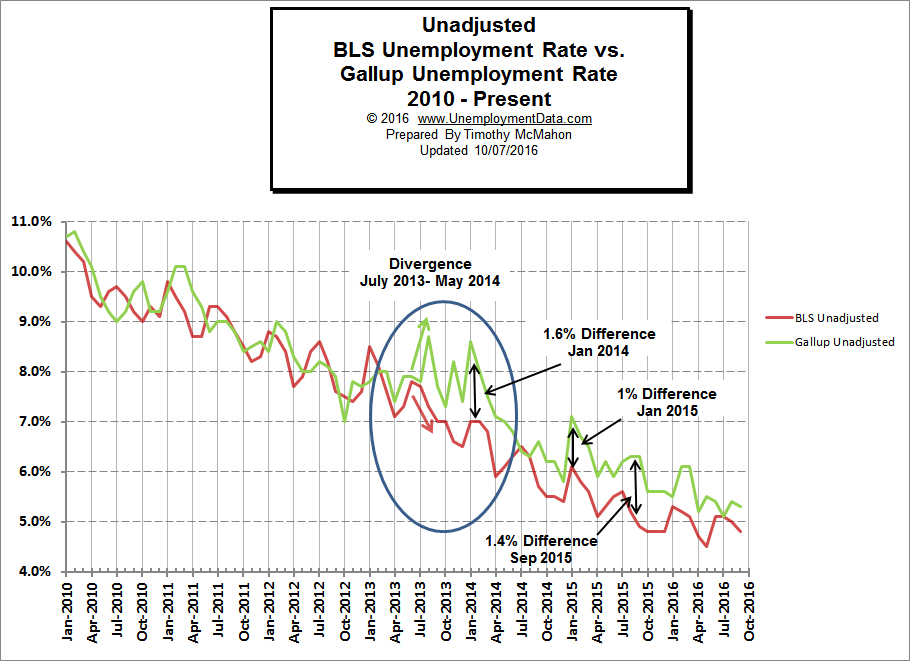 Compare the Bureau of Labor Statistics (BLS) unemployment numbers with the unemployment numbers generated by the Gallup Survey people. Unfortunately, they often present a different picture. Typically the BLS data says the unemployment rate is on average 0.6361% lower than the independently surveyed Gallup numbers. And September was no different with the BLS numbers lower than Gallups. Compare the BLS and Gallup numbers.