On Friday January 9th the U.S. Bureau of Labor Statistics (BLS) released the Unemployment Data for December 2014. According to the BLS the Current Unemployment Rate (Seasonally adjusted) for December was 5.6% down from 5.8% in November.
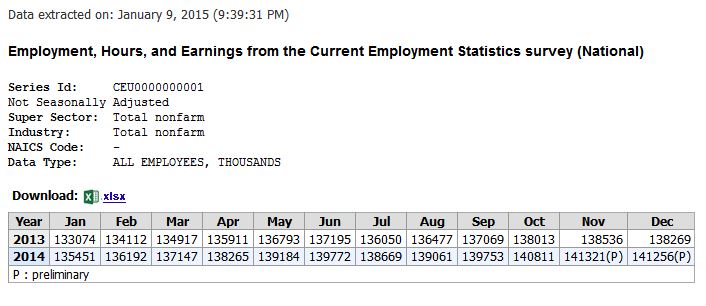
Along the same lines we see the Unadjusted Unemployment rates fall from 5.5% to 5.4% at first that seems to make sense. But if we look at the Current Employment Data we will see a different picture. According to the BLS there were 141,256,000 people employed in December and 141,321,000 employed in November that is a net loss of 65,000 jobs… some of that can be explained by the typical employment peak which ends after Black-Friday. Because employment typically peaks in November the “Seasonally Adjusted” numbers adjust for that and so it is understandable that the Seasonally adjusted unemployment rate could fall while actual employment was falling… but how can unadjusted unemployment fall with fewer people actually working?
If you listened to the “Commissioner’s Statement” you would believe that all was well. It says, “Nonfarm payroll employment rose by 252,000 in December, and the unemployment rate declined by 0.2 percentage point to 5.6 percent. Job gains occurred in professional and business services, construction, food services and drinking places, health care, and manufacturing.” and “Professional and business services employment rose by 52,000 in December… Construction added 48,000 jobs… employment in food services and drinking places rose by 44,000… Health care added 34,000 jobs… Manufacturing employment rose by 17,000… “ But when you look at the actual NonFarm Employment you wonder what the commissioner is talking about. Here is an actual screen capture of the BLS data.
Unless I’m crazy it says “Not Seasonally Adjusted” Total Non-farm employees in thousands. Looking at November I see the preliminary numbers are 141,321 (thousand) and for December I see 141,256 (thousand) when I went to school 256 was less than 321 by 65 so I see a net loss of 65 thousand jobs not the gain of 252 thousand the commissioner is talking about. I’ve written to the BLS asking about this discrepancy and will keep you posted on their response.
The BLS Response: Oh we were using “Seasonally Adjusted Employment Numbers”.
It’s nice to know that even though there were fewer real jobs (but not as many fewer as last year) so therefore the imaginary jobs went up, so all is well. <sarcasm>
I’ve told you before that in January the numbers magically change every year but so far I don’t see any change in these numbers although the Commissioner’s Statement did say “Following our regular annual practice, seasonal adjustment factors for the household survey data have been updated in this news release. Seasonally adjusted estimates going back 5 years– to January 2010–were subject to revision.” Although last year the adjustments went back to 1979 even though they denied it. And these numbers clearly state that they are not Seasonally Adjusted so why would they need adjusting?
I wonder if the table will magically change the next time I look? That is why I’ve included a screen shot here.
You might also like:

