
The Bureau of Labor Statistics published the July Employment/Unemployment numbers on August 5th .
- The seasonally adjusted U-3 (the commonly quoted unemployment rate) was unchanged at 4.9%.
- BLS’ Unadjusted U-3 was also unchanged at 5.1%.
- BLS’ Unadjusted U-6 increased 0.2% to 10.1%
- Gallup’s unadjusted U-3 fell from 5.4% to join the BLS’ 5.1%.
- Gallup’s U-6 fell from 13.4% to 12.7% to remain 2.6% higher than the BLS’ U-6.
Meanwhile, MSN’s CNBC decided to enter the fray and help “clarify” the confusing employment situation with an article entitled “Now that you know the official jobs number, here’s the real unemployment rate”. Unfortunately, this article may do more to confuse than to clarify.
In the article author Nicholas Wells delves into the possibility that the U-3 is not as important as the U-6… which we have been saying in our article “What is the Real Unemployment Rate?” for ages.
Next Wells takes on the Employment numbers by saying, “Economists were looking for evidence of sustained gains in the labor market after a disappointing May added only 11,000 jobs. The market rebounded in June with a gain of 292,000 jobs. The nation added 255,000 jobs in July, beating economists’ estimates of around 180,000.” Unfortunately, he failed to address the issue of Seasonally adjusted Employment data and look at the Unadjusted Employment Data. If we look at the unadjusted numbers we find that we have not seen a “gain of 292,000 jobs” but rather employment was actually 145,215,000 in June and 144,185,000 in July… thus there was actually a net LOSS of -1.03 million jobs rather than a gain of 292,000.
Next he addresses the Labor Force Participation Rate (LFPR) telling us, “The participation rate has fallen since the recession, largely because of demographic shifts such as the baby boomers retiring… ” this is an easy assumption to make unfortunately it is untrue. We have repeatedly debunked this myth in several places including here saying, “Some people wrongly assume that the LFPR is falling due to retiring baby-boomers. This premise however has been proven false. See Record Low LFPR which shows the LFPR by age group since 1999. The biggest declines occur in the younger ages while those above age 60 actually show a higher percentage are working. For instance, in 1999 only 24% of those age 65-69 were working but according to the BLS by 2015 it had risen to 30.8% of those age 65-69 were working.”
Then Wells cites a study by Harvard Economists trying to convince us that the loss of high wage jobs and growth of low wage jobs is somehow good for the economy. But concludes the section with ” In July, average hourly wages were up to $25.69. Average weekly wages rose to $886.31.”
And then finally he closes with this whopper, “With the 255,000 jobs in July, the nation has netted more than 10 million jobs since President Obama took office. At this point in his tenure, that’s around half the jobs added during Bill Clinton’s terms and a little less than those added under Ronald Reagan.”
If you look at the BLS Total Non-Farm Employment NOT Seasonally Adjusted, you will see that from Jan 2008 to the present under Obama employment increased by 7.917 Million. This is no where near “over 10 million” as claimed by Wells. Next we see that under Reagan Jan 81-Dec 88 employment increased by 17.885 million, well over double Obama’s rate. So it is not “a little less than those added under Ronald Reagan” as Wells contends. And the increase under Clinton from Jan 93 – Dec 00 was 25.452 million, so Obama’s rate is less than one third of Clinton’s not “around half ” as Wells would have you believe.
And those earlier increases were a much higher percentage increase of the actual population than the current gain. Looking at the table below we can see that based on the labor force at the start of their Presidency and the increase in jobs during their tenure Reagan saw an increase of 16.56%, Clinton had a 19.82% increase in jobs and Obama had a pitiful 5.13%.
Although Wells didn’t mention Bush, just for fun I included his results which included the abysmal 2+million jobs lost in the last six months of his presidency. Without that drop his performance would have easily beat Obama’s and put him in the 6% range and to say Obama barely beat Bush’s abysmal performance isn’t saying much.
Jobs Increase as a % of Labor Force
| Year | President | Labor Force | Jobs Increase | % Increase | |
| 1981-88 | Reagan | 108,026,000 | 17,885,000 | 16.56% | |
| 1993-00 | Clinton | 128,400,000 | 25,452,000 | 19.82% | |
| 2008-16 | Obama | 154,063,000 | 7,917,000 | 5.13% | |
| 2000-08 | Bush 2 | 142,267,000 | 6,727,000 | 4.72% |
Source:
See Also:
Unemployment Rate Chart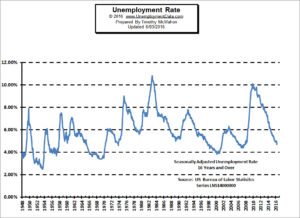 –
–
The seasonally adjusted unemployment rate
from 1948 to the present is one of the most watched statistics.
Where is it now and should you trust it?
U-6 Unemployment Rate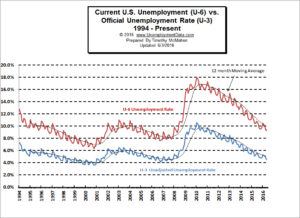 –
–
U-6 is the broadest measure of unemployment and includes
all classes of Unemployed plus those ”marginally attached”
and/or part-time for economic reasons.
Current Employment Data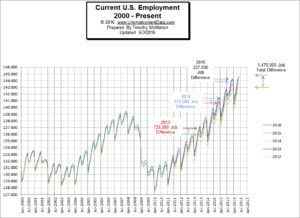 –
–
How many jobs are there actually?
This chart shows Employment since Jan 2000
and what the current trend is.
Historical Employment Data Chart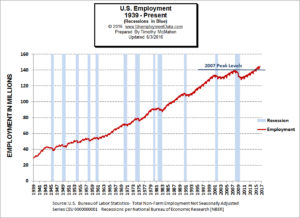 –
–
How Many People Are Actually Employed?