• About WordPress
    • WordPress.org
    • Documentation
    • Learn WordPress
    • Support
    • Feedback
  • Log In
  • Skip to primary navigation
  • Skip to main content
  • Skip to primary sidebar
  • Home
  • Contact us
  • Related Sites
    • InflationData.com
    • Financial Trend Forecaster
    • Your Family Finances
    • Elliott Wave University
    • Optio Money
  • About
    • Terms of Use
    • Disclaimer & Disclosure
    • Privacy Statement
  • Sitemap
    • 2009-2010 Posts
    • 2011 Posts

UnemploymentData.com

Your Source for Employment and Unemployment Data

Unemployment
  • Charts
    • Current Unemployment Rate Chart
    • Current Employment Rate (Chart and Data)
    • Current Employment vs Unemployment Chart
    • Historical Employment Data
    • Employment Population Ratio
    • Misery Index
  • Unemployment
    • Historical Unemployment Rate Tables
    • What Is U-6 Unemployment?
    • Unadjusted vs. Seasonally Adjusted U-3 Unemployment Rate
    • BLS vs. Gallup Unemployment Numbers
    • Current U-6 Unemployment Rate
    • What is the Labor Force Participation Rate?
    • What is the Real Unemployment Rate?
  • Employment
    • Current Employment Rate (Chart and Data)
    • Historical Employment Data
    • Contacting a Live Person at the State Employment Commission
      • How to Talk to a Live Person at the Virginia Unemployment Commission
      • Florida’s FLUID Unemployment Program
    • Benefits
      • Insurance
      • Retirement
    • Careers
    • Employment Costs
    • Experience
    • Government
    • Job Hunting
      • Interview
      • Resume
  • Find Articles
  • Education
    • Skills
  • General
    • Small Business
      • Outsourcing
    • Success
You are here: Home / Unemployment / BLS Releases August Unemployment: 6.1% Down from 6.2% in July

BLS Releases August Unemployment: 6.1% Down from 6.2% in July

September 6, 2014 by Tim McMahon

The U.S. Bureau of Labor Statistics (BLS) released the August Unemployment figures on September 5th. The Seasonally Adjusted Unemployment Rate was 6.2% up from 6.1% in June. The Unadjusted Unemployment rate was also down from 6.5% in July to 6.3% in August.

BLS vs GallupIn another rare occurrence, the BLS seasonally adjusted numbers are actually identical to the Gallup numbers for the first time since September 2011. In the interim the BLS has been lower than the Gallup numbers 24 times and Gallup has been lower 9 times. The average difference when the BLS is lower is  0.6% but when Gallup is lower the average has only been 0.3%. So in addition to BLS being lower more often it is also lower by more indicating some sort of bias to the downside. But perhaps the BLS is mending their ways since last month and this month have resulted in the BLS and Gallup being well within a normal margin of error.

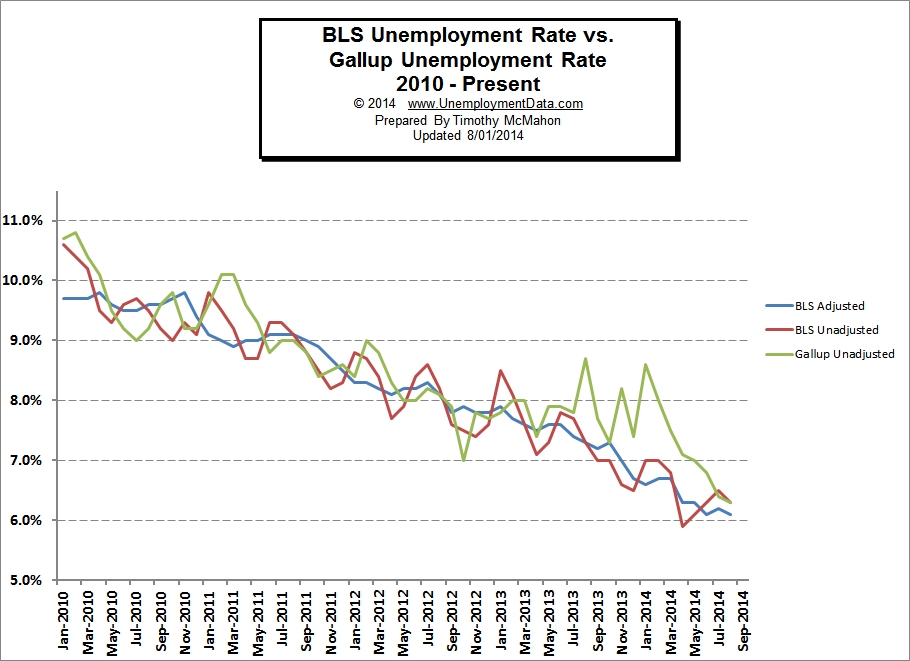
According to the commissioner of the Bureau of Labor Statistics monthly report, “Total nonfarm payroll employment increased by 142,000 in August, and the unemployment rate was little changed at 6.1 percent… In August, both the unemployment rate (6.1 percent) and the number of unemployed persons (9.6 million) changed little. Over the year, the unemployment rate and the number of unemployed persons were down by 1.1 percentage points and 1.7 million, respectively.”

On an unadjusted basis the employment numbers look even better with employment up 2.5 million and unemployment was down from 7.3% in August 2013 to 6.3% in August 2014.

The BLS says the broader U-6 unemployment fell from 12.6% in July to 12.0% in August while Gallup says that it is actually 15.1% a difference of 2.5% or a  20.8% margin of error.  Many people consider the U-6 unemployment rate to be the “real” unemployment rate because it includes “discouraged workers” i.e. those who would like to work but have given up looking because they don’t feel there are any jobs available for them. See What is U-6 Unemployment? for more information.

Payroll to Population Rate

The payroll to population rate looks at a slightly different metric than the unemployment rate although at first blush it sounds similar. While the unemployment rate looks at  the percentage of the “workforce” that can’t find a job (and a fairly narrow definition of the term workforce at that). Gallup’s Payroll to Population rate (P2P) looks at the percentage of the total population that is working. This number, in my opinion, is much less subject to fudging since although you can redefine the term “workforce” as evidenced by the various unemployment rates (U1 through U-6) it is much more difficult to redefine the total population of the United States.

Unlike the unemployment rate where a lower number is better, in the P2P, a higher number is better in that it indicates a greater percentage of the population is working. In August, Gallup’s P2P was 44.9% down from July’s 45.1% and June’s 45.0%.

See Also:

  • Current Employment Data
  • Historical Employment Data Chart
  • U-6 Unemployment Rate
  • Unemployment Rate Chart
  • Seasonally Adjusted Unemployment Rate in Table form
  • Misery Index

Filed Under: Unemployment

About Tim McMahon

Work by editor and author, Tim McMahon, has been featured in Bloomberg, CBS News, Wall Street Journal, Christian Science Monitor, Forbes, Washington Post, Drudge Report, The Atlantic, Business Insider, American Thinker, Lew Rockwell, Huffington Post, Rolling Stone, Oakland Press, Free Republic, Education World, Realty Trac, Reason, Coin News, and Council for Economic Education. Connect with Tim on Google+

Primary Sidebar

Search Site

Sponsored:

Here's the Best Day to Buy Nvidia

Did you know Nvidia has an 86% history of soaring, beginning on one particular day every single spring? We call this the "Green Day phenomenon." It works on 5,000 stocks. For example, Tesla has a 100% history of soaring beginning on one particular day every single year.

Click here to see the green days for 5 major stocks today.

Recent Posts

  • May Employment Nothing Burger
  • April 2025 Employment / Unemployment Report
  • Would More Jobs Help Social Security?
  • March 2025- Employment / Unemployment Report
  • February 2025 Jobs Report

Resources

  • Bureau of Labor Statistics Current Population Survey Monthly survey of households conducted by the Bureau of Census for BLS. It provides data on the labor force, employment, unemployment, etc.
  • Capital Professional Services Providing web design and development and Internet marketing services
  • Elliott Wave University Using the Elliott Wave Principle to improve investment performance
  • Financial Trend Forecaster Featuring Moore Inflation Predictor, NYSE Rate of Change and NASDAQ Rate of change
  • InflationData.com Inflation calculators, databases, etc.
  • Intergalactic Web Designers Web design and development services
  • Your Family Finances

Articles by Category

Articles by Date

Disclaimer

At UnemploymentData.com we are not registered investment advisors and do not provide any individualized advice. Past performance is not necessarily indicative of future performance and future accuracy and profitable results cannot be guaranteed.

Privacy & Terms of Use

Privacy Statement & Terms of Use

Do Not Sell My Information

Copyright © 2025 · News Pro on Capital Professional Services, LLC. All rights reserved · Log in