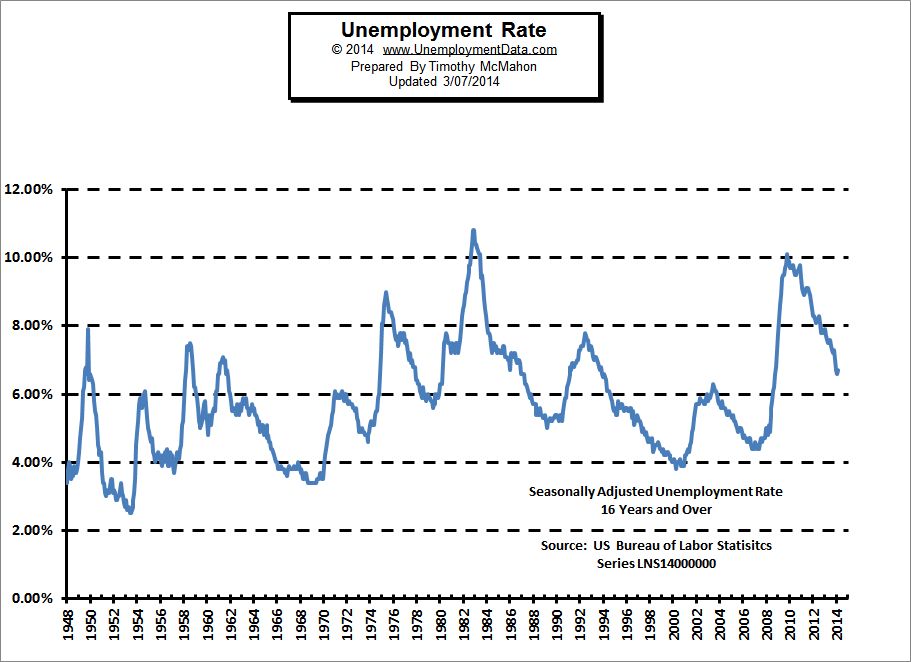
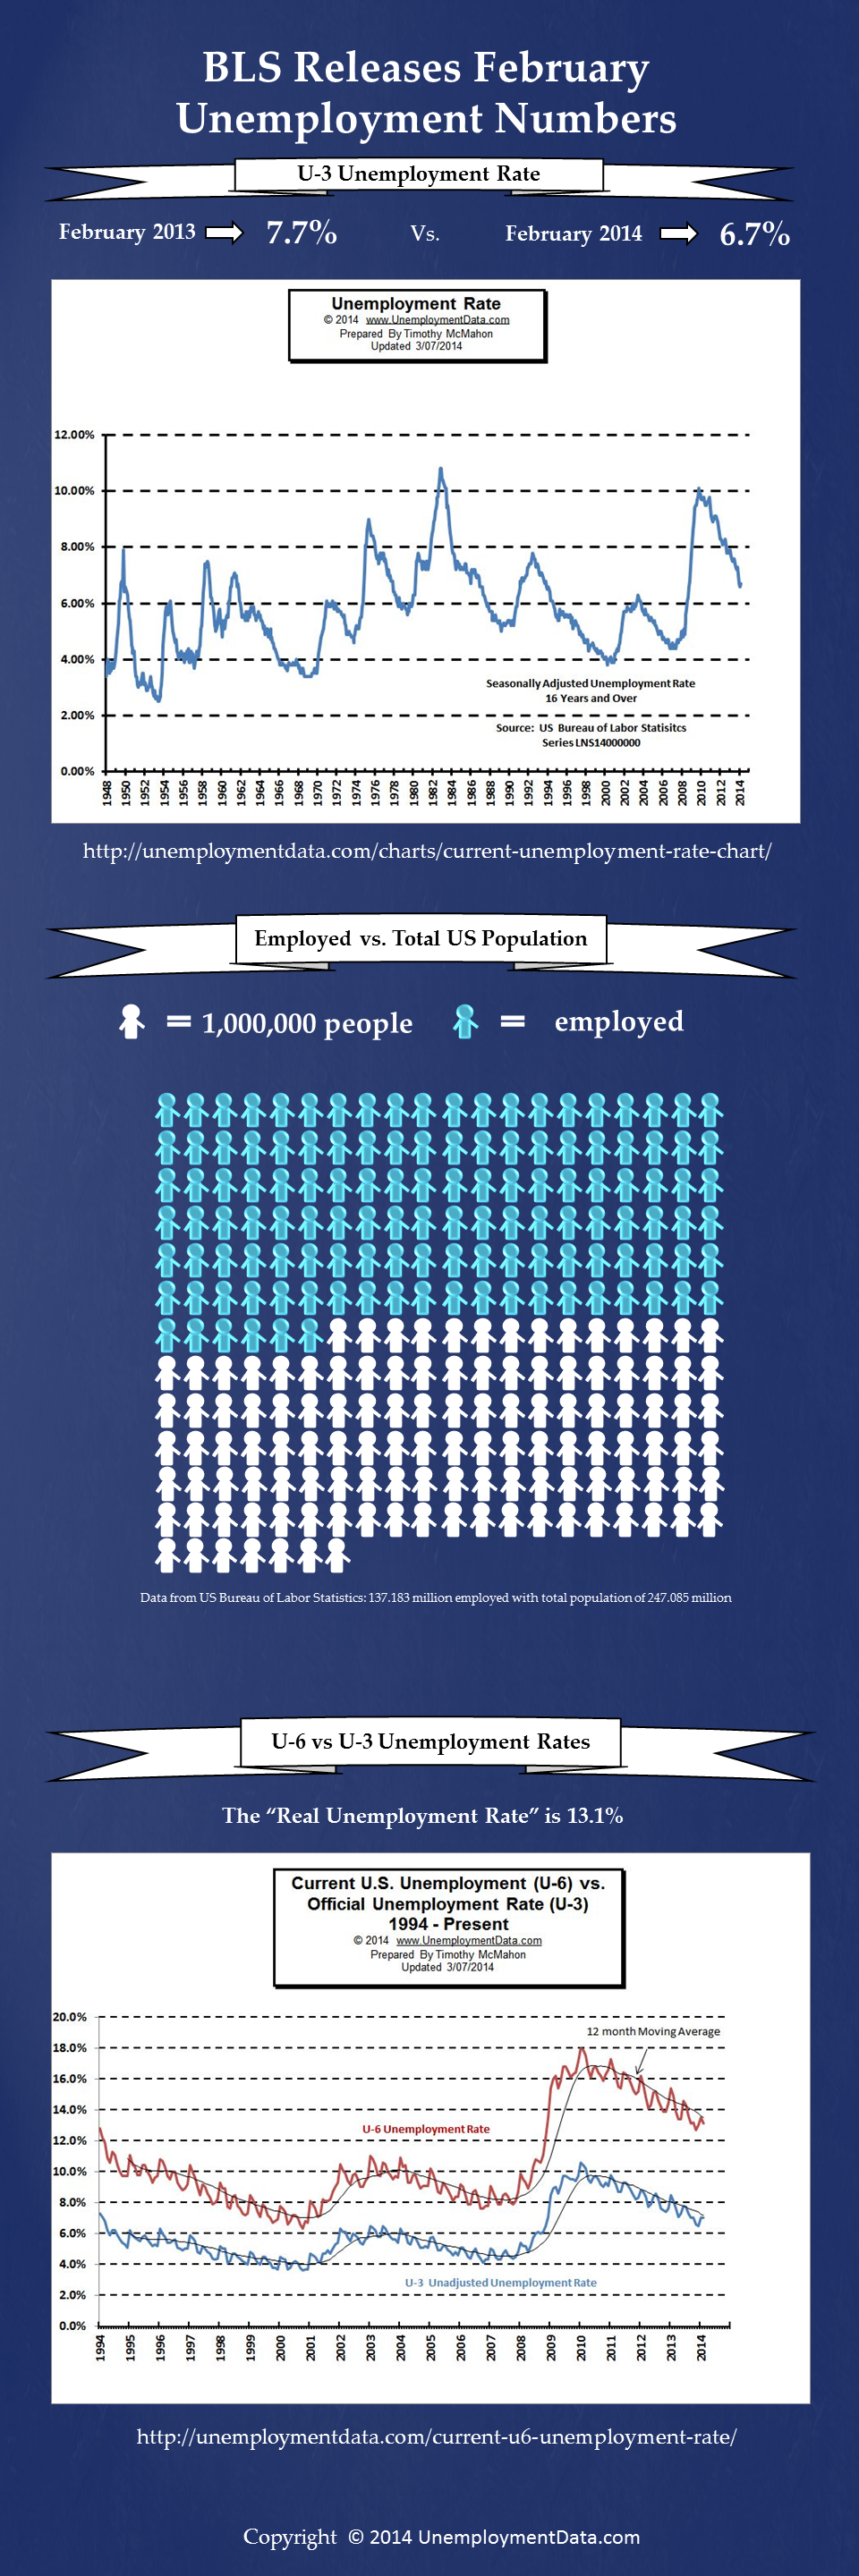
For those of you who are more visual thinkers and like to see pictures rather than read a bunch of numbers, here’s an infographic we’ve created to illustrate the important statistics for February 2014 from the US Bureau of Labor Statistics.
If you wish to embed this graphic on your own site, please use the following code:
<a href=”https://unemploymentdata.com”><img alt=”February 2014 US Unemployment statistics” src=”https://unemploymentdata.com/wp-content/uploads/2014/03/Feb2014Unemployment.png” width=”576″ height=”1728″ /></a>