U.S. Unemployment Rate by State
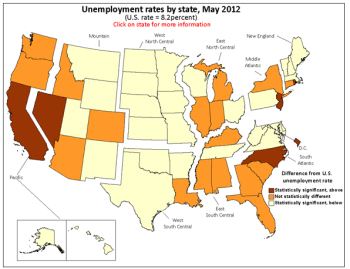
The U.S. Bureau of Labor Statistics has released their Unemployment rates by State. So we can see how the various states compare. From the chart below we can see that California, Nevada, North Carolina, New Jersey, Washington D.C., and Rhode Island are all doing worse than the national average. New York, Connecticut, Michigan, Indiana, Illinois, Kentucky, South Carolina, Georgia, Florida, Alabama, Mississippi, Louisiana, Colorado, Idaho, New Mexico, Washington and Oregon are all average in their unemployment rates while the remainder are above average.
How the Unemployment Rates of Various States Compare
Nevada continued to record the highest unemployment rate among the states at 11.6 percent in May. Rhode Island and California posted the next highest rates, 11.0 and 10.8 percent, respectively. North Dakota again registered the lowest jobless rate, 3.0 percent, followed by Nebraska, 3.9 percent.
South Dakota, 4.3%, Vermont 4.6%, and Oklahoma at 4.8% were all below 5%. While New Hampshire, Iowa, Wyoming, Minnesota, and Virginia were all between 5% and 6%.
| State | Unemployment rate |
| Alabama | 7.4% |
| Alaska | 7.0% |
| Arizona | 8.2% |
| Arkansas | 7.3% |
| California | 10.8% |
| Colorado | 8.1% |
| Connecticut | 7.8% |
| Delaware | 6.8% |
| District of Columbia | 9.3% |
| Florida | 8.6% |
| Georgia | 8.9% |
| Hawaii | 6.3% |
| Idaho | 7.8% |
| Illinois | 8.6% |
| Indiana | 7.9% |
| Iowa | 5.1% |
| Kansas | 6.1% |
| Kentucky | 8.2% |
| Louisiana | 7.2% |
| Maine | 7.4% |
| Maryland | 6.8% |
| Massachusetts | 6.0% |
| Michigan | 8.5% |
| Minnesota | 5.6% |
| Mississippi | 8.7% |
| Missouri | 7.3% |
| Montana | 6.3% |
| Nebraska | 3.9% |
| Nevada | 11.6% |
| New Hampshire | 5.0% |
| New Jersey | 9.2% |
| New Mexico | 6.7% |
| New York | 8.6% |
| North Carolina | 9.4% |
| North Dakota | 3.0% |
| Ohio | 7.3% |
| Oklahoma | 4.8% |
| Oregon | 8.4% |
| Pennsylvania | 7.4% |
| Rhode Island | 11.0% |
| South Carolina | 9.1% |
| South Dakota | 4.3% |
| Tennessee | 7.9% |
| Texas | 6.9% |
| Utah | 6.0% |
| Vermont | 4.6% |
| Virginia | 5.6% |
| Washington | 8.3% |
| West Virginia | 6.9% |
| Wisconsin | 6.8% |
| Wyoming | 5.2% |
State Unemployment Rates vs Political Party Affiliation
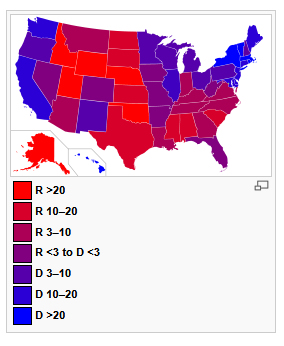
The following graphic shows states by political party affiliation based on the most recent Presidential elections. It looks very similar to the above graphic of unemployment rates.
Red=Republican, Blue=Democrat, Purple = Mixed .
Based on Wikipedia Red and Blue States

The following table is sorted with the lowest Unemployment states at the top and the highest at the bottom.
If we look at the states based on the Party affiliation of the State legislature which presumably would have the most influence on the political climate of the state. Red=Republican, Blue=Democrat, Purple = Mixed
The first table includes the best 25% of the states i.e. those with the lowest unemployment rate. aka the top 25th percentile.
| Lowest 25% Unemployment Rate States | ||
| State | Unemployment Rate | State Legislature Affiliation |
| North Dakota | 3.0% | Republican |
| Nebraska | 3.9% | Mixed |
| South Dakota | 4.3% | Republican |
| Vermont | 4.6% | Democrat |
| Oklahoma | 4.8% | Republican |
| New Hampshire | 5.0% | Republican |
| Iowa | 5.1% | Mixed |
| Wyoming | 5.2% | Republican |
| Minnesota | 5.6% | Republican |
| Virginia | 5.6% | Republican |
| Massachusetts | 6.0% | Democrat |
| Utah | 6.0% | Republican |
| Kansas | 6.1% | Republican |
Next, we’ll look at the bottom 12th percentile i.e. those with the worst unemployment rates.
| Highest 12% Unemployment Rate States | ||
| State | Unemployment Rate | State Legislature Affiliation |
| New Jersey | 9.2% | Democrat |
| District of Columbia | 9.3% | Democrat |
| North Carolina | 9.4% | Republican |
| California | 10.8% | Democrat |
| Rhode Island | 11.0% | Democrat |
| Nevada | 11.6% | Democrat |
Of the bottom 25th percentile i.e. those with the worst unemployment rates 7 are Democratic and 6 are Republican but I’m not sure how Michigan elected a Republican legislature since they traditionally vote Democrat in Presidental elections. Montana 6.3%, Minnesota 5.6%, New Hampshire 5.0%, and North Carolina 9.4% have Democrats for Governor and Republican houses which may qualify them as Purple states. New Mexico with an Unemployment rate of 6.7% has a Democratic House and a Republican Governor.
| Highest 25% Unemployment Rate States | ||
| State | Unemployment Rate | State Legislature Affiliation |
| Michigan | 8.5% | Republican |
| Florida | 8.6% | Republican |
| Illinois | 8.6% | Democrat |
| New York | 8.6% | Democrat |
| Mississippi | 8.7% | Republican |
| Georgia | 8.9% | Republican |
| South Carolina | 9.1% | Republican |
| New Jersey | 9.2% | Democrat |
| District of Columbia | 9.3% | Democrat |
| North Carolina | 9.4% | Republican |
| California | 10.8% | Democrat |
| Rhode Island | 11.0% | Democrat |
| Nevada | 11.6% | Democrat |
Here is the full Table:
| State | Unemployment Rate |
State Legislature Affiliation |
| North Dakota | 3.0% | Republican |
| Nebraska | 3.9% | Mixed |
| South Dakota | 4.3% | Republican |
| Vermont | 4.6% | Democrat |
| Oklahoma | 4.8% | Republican |
| New Hampshire | 5.0% | Republican |
| Iowa | 5.1% | Mixed |
| Wyoming | 5.2% | Republican |
| Minnesota | 5.6% | Republican |
| Virginia | 5.6% | Republican |
| Massachusetts | 6.0% | Democrat |
| Utah | 6.0% | Republican |
| Kansas | 6.1% | Republican |
| Hawaii | 6.3% | Democrat |
| Montana | 6.3% | Republican |
| New Mexico | 6.7% | Democrat |
| Delaware | 6.8% | Democrat |
| Maryland | 6.8% | Democrat |
| Wisconsin | 6.8% | Republican |
| Texas | 6.9% | Republican |
| West Virginia | 6.9% | Democrat |
| Alaska | 7.0% | Republican |
| Louisiana | 7.2% | Republican |
| Arkansas | 7.3% | Democrat |
| Missouri | 7.3% | Mixed |
| Ohio | 7.3% | Mixed |
| Alabama | 7.4% | Republican |
| Maine | 7.4% | Republican |
| Pennsylvania | 7.4% | Republican |
| Connecticut | 7.8% | Democrat |
| Idaho | 7.8% | Republican |
| Indiana | 7.9% | Republican |
| Tennessee | 7.9% | Republican |
| Colorado | 8.1% | Mixed |
| Arizona | 8.2% | Republican |
| Kentucky | 8.2% | Mixed |
| Washington | 8.3% | Democrat |
| Oregon | 8.4% | Mixed |
| Michigan | 8.5% | Republican |
| Florida | 8.6% | Republican |
| Illinois | 8.6% | Democrat |
| New York | 8.6% | Mixed |
| Mississippi | 8.7% | Republican |
| Georgia | 8.9% | Republican |
| South Carolina | 9.1% | Republican |
| New Jersey | 9.2% | Democrat |
| District of Columbia | 9.3% | Democrat |
| North Carolina | 9.4% | Republican |
| California | 10.8% | Democrat |
| Rhode Island | 11.0% | Democrat |
| Nevada | 11.6% | Democrat |
The average unemployment Rate of Republican States is 7.0%%
The average for the Democratic States is 8.0%,
There are 5 mixed states with the lower house one party and the upper house another party. Their average is in the middle between Democratic And Republican numbers at 7.6%.
See Also:
Is the Government Fudging Unemployment Numbers?
Articles on:
Data Source:
U.S. Bureau of Labor Statistics May 2012 Unemployment Rates by State Click for interactive Image
Wikipedia List of State Legislatures


[…] May Unemployment Statistics by U.S. State […]