• About WordPress
    • WordPress.org
    • Documentation
    • Learn WordPress
    • Support
    • Feedback
  • Log In
  • Skip to primary navigation
  • Skip to main content
  • Skip to primary sidebar
  • Home
  • Contact us
  • Related Sites
    • InflationData.com
    • Financial Trend Forecaster
    • Your Family Finances
    • Elliott Wave University
    • Optio Money
  • About
    • Terms of Use
    • Disclaimer & Disclosure
    • Privacy Statement
  • Sitemap
    • 2009-2010 Posts
    • 2011 Posts

UnemploymentData.com

Your Source for Employment and Unemployment Data

Unemployment
  • Charts
    • Current Unemployment Rate Chart
    • Current Employment Rate (Chart and Data)
    • Current Employment vs Unemployment Chart
    • Historical Employment Data
    • Employment Population Ratio
    • Misery Index
  • Unemployment
    • Historical Unemployment Rate Tables
    • What Is U-6 Unemployment?
    • Unadjusted vs. Seasonally Adjusted U-3 Unemployment Rate
    • BLS vs. Gallup Unemployment Numbers
    • Current U-6 Unemployment Rate
    • What is the Labor Force Participation Rate?
    • What is the Real Unemployment Rate?
  • Employment
    • Current Employment Rate (Chart and Data)
    • Historical Employment Data
    • Contacting a Live Person at the State Employment Commission
      • How to Talk to a Live Person at the Virginia Unemployment Commission
      • Florida’s FLUID Unemployment Program
    • Benefits
      • Insurance
      • Retirement
    • Careers
    • Employment Costs
    • Experience
    • Government
    • Job Hunting
      • Interview
      • Resume
  • Find Articles
  • Education
    • Skills
  • General
    • Small Business
      • Outsourcing
    • Success
You are here: Home / Employment / BLS Issues New Job Creation Estimates

BLS Issues New Job Creation Estimates

April 3, 2012 by Tim McMahon

The U.S. Bureau of Labor Statistics (BLS) has just released its latest revision of its annual Occupational Outlook Handbook (OOH). This is a great resource for those interested in changing jobs or for students trying to decide on a career. The OOH lists job descriptions, average salaries and estimates of the number of new jobs that will be created between 2010 and 2020. Obviously when choosing a new career it is best to be in a position that has increasing demand rather than finding yourself in an industry such as buggy whip maker where finding a job becomes increasingly difficult. If your position is in demand and supply is tight the natural progression will be increasing salaries, bigger signing bonuses and more benefits as companies compete for the limited number of candidates available.

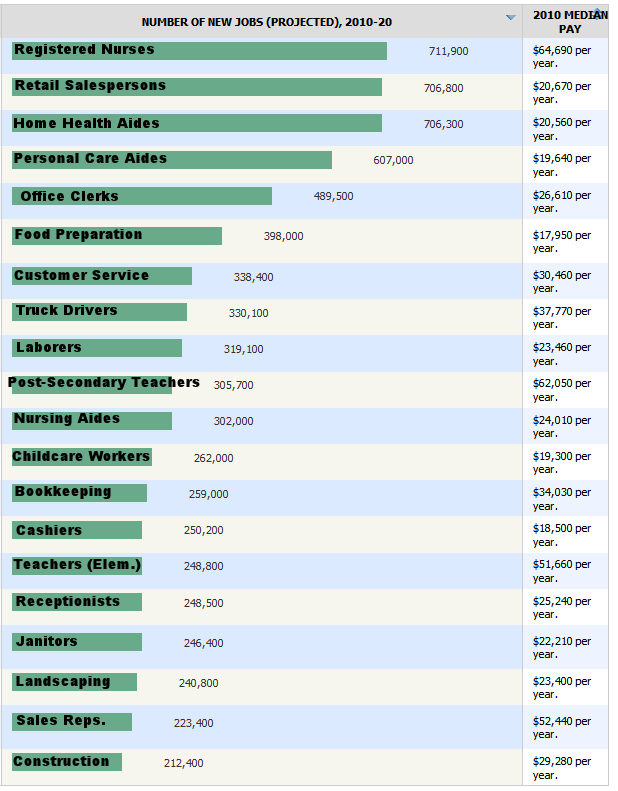
According to the most recent data from the BLS, many of the new positions with the best salaries are in the health care arena, which makes sense in a time of aging Baby Boomers. For instance the number one position with the greatest increase in demand is for Registered Nurses. The BLS estimates 711,900 new nurses will be needed during the decade between 2010 and 2020. Plus, the salary of registered nurses is the highest of any of the top 20 growth positions with a median annual salary in 2010 of $64,690.

Click for Larger Image

Unfortunately, many of the other growth positions are not so fortunate either having significantly lower growth rates or significantly lower salaries.  For instance, the second highest growth position is for retail sales persons. The BLS estimates 706,800 new retail sales positions and unfortunately their salaries averaged only $20,670 in 2010. The third highest growth position is also in the health care industry and it is Home Health Aides but once again it is a relatively low paying position averaging $20,560 per year. Other growing healthcare positions are Personal Care Aides (607,000 new jobs) $19,640 and  Nursing Aides, Orderlies and Attendants (302,000 new jobs) $24,010.

 Some of the other better paying growth jobs are Post Secondary Teachers (i.e. College Professors) (305,700 new jobs) $62,050. Based on the growth estimates for professors, it seems that the BLS estimates that more people will be going to college in an effort to upgrade their skills in order to better compete for the few good jobs available.

The third highest paying growth position is Wholesale and Manufacturing Sales Reps with 223,400 new jobs and an average salary of $52,440. This is followed closely by Elementary School Teachers with 248,800 new jobs and an average annual salary of $51,660. From there the average salaries drop rapidly with the next highest salary at $37,770 for Tractor Trailer Truck Drivers (330,100 new jobs), followed by 259,000 Bookkeeping and Accounting Clerks making an average of $34,030 per year. Unfortunately, a full 13 of the 20 growth jobs average less than $30,000 per year including Food Preparation i.e. fast food making $17,950, cashiers ($18,500), childcare workers ($19,300), personal care aides ($19,640), retail sales ($20,670), janitors ($22,210), landscaping ($23,400), laborers ($23,460), nursing aides ($24,010), receptionists ($25,240), office clerks ($26,610), and construction laborers ($29,280). And making just a bit more at $30,460 Customer Service Representatives.

Filed Under: Employment Tagged With: growth, jobs

About Tim McMahon

Work by editor and author, Tim McMahon, has been featured in Bloomberg, CBS News, Wall Street Journal, Christian Science Monitor, Forbes, Washington Post, Drudge Report, The Atlantic, Business Insider, American Thinker, Lew Rockwell, Huffington Post, Rolling Stone, Oakland Press, Free Republic, Education World, Realty Trac, Reason, Coin News, and Council for Economic Education. Connect with Tim on Google+

Primary Sidebar

Search Site

Sponsored:

URGENT: These Stocks Stand Poised to Benefit from President Trump's Trade Wars!

As the Trump administration moves ahead with aggressive tariff policies on key imports, the mainstream media is scrambling.

This Free Report - which you can download now - reveals the names and ticker symbols of 5 Stock Poised to Benefit Most from President Trump's Tariff Wars.

Click Here to Download Your FREE Stock Report Now.

Recent Posts

  • April 2025 Employment / Unemployment Report
  • Would More Jobs Help Social Security?
  • March 2025- Employment / Unemployment Report
  • February 2025 Jobs Report
  • January 2025 BLS Employment Report

Resources

  • Bureau of Labor Statistics Current Population Survey Monthly survey of households conducted by the Bureau of Census for BLS. It provides data on the labor force, employment, unemployment, etc.
  • Capital Professional Services Providing web design and development and Internet marketing services
  • Elliott Wave University Using the Elliott Wave Principle to improve investment performance
  • Financial Trend Forecaster Featuring Moore Inflation Predictor, NYSE Rate of Change and NASDAQ Rate of change
  • InflationData.com Inflation calculators, databases, etc.
  • Intergalactic Web Designers Web design and development services
  • Your Family Finances

Articles by Category

Articles by Date

Disclaimer

At UnemploymentData.com we are not registered investment advisors and do not provide any individualized advice. Past performance is not necessarily indicative of future performance and future accuracy and profitable results cannot be guaranteed.

Privacy & Terms of Use

Privacy Statement & Terms of Use

Do Not Sell My Information

Copyright © 2025 · News Pro on Capital Professional Services, LLC. All rights reserved · Log in