Will the “Real Unemployment Rate” Please Stand Up?
Many economists believe that the popularly quoted U-3 Unemployment Rate understates the real unemployment rate because it excludes workers who would like to work but have given up looking because they don’t think there are any jobs available.
Is U-6 the “Real Unemployment Rate”?
The U-6 is the broadest measure of unemployment. It includes everyone in U3 plus those who have given up looking for work and those working part-time but would prefer to work full-time. Many people consider U-6 the “REAL” unemployment rate… although the Bureau of Labor Statistics gives that honor to U-3. Thus the Seasonally Adjusted U-3 is the commonly quoted “unemployment rate” in the media.
See: What is U-6 Unemployment?

U-6 also includes “Part-time workers who want to work full-time, but cannot due to economic reasons,” i.e., workers who have had their hours cut rather than being laid-off. It also includes workers who can’t find full-time employment. Many minimum wage employers do not hire full-time workers, so they don’t have to pay benefits. So are these part-time workers really unemployed? They may be “underemployed” but aren’t really unemployed. So a case can be made that U-6 is too broad and that the real unemployment rate is somewhat less than U-6.
What Is U-5 Unemployment?
Slightly less inclusive, U-5 doesn’t include part-time workers who want to work full-time but includes “marginally or loosely attached workers” and those who “would like” and can work but have not looked for work recently.
A marginally attached worker is someone who has looked for work within the last 12 months but has decided to pursue other options, such as continuing their education or staying at home for other reasons. A discouraged worker is a subset of the marginally attached group. They have given up looking for work for a specific reason, i.e., they don’t feel there is any work available for them anyway, so why bother looking?
Of this group, the question arises, if someone decides to go back to school, are they really unemployed? A good case can be made that they aren’t really unemployed. Now, they are a “student”. I suppose they could be both discouraged and have therefore decided to go back to school to improve their skills, but in the long run, is that a bad thing? After graduating, they will have higher-value skills and thus be more employable and earn more over their lifetimes.
What Is U-4 Unemployment?
U-4 unemployment includes the labor force that has been unemployed for 15 weeks or longer. It also consists of those who’ve just lost their jobs and those who have completed temporary work. Plus, those who have actively looked for work within the last four weeks, and those who are discouraged and have therefore given up looking for work. It does not include students who were previously employed (U-5) or part-time workers who would like to work full-time. Many believe that this is the real Unemployment Rate.
Here is a sample of the Data Collected and how it breaks down (Data in Thousands):
| Category | Sep-11 | Sep-12 | ||||||
| Total not in the labor force | 86,049 | 88,697 | ||||||
| Do not want a job now | 80,120 | 82,271 | ||||||
| Want a job | 5,929 | 6,427 | ||||||
| Didn’t search for work in the previous year | 2,887 | 3,278 | ||||||
| Searched for work but not in 4 wks | 3,042 | 3,149 | ||||||
| Not available to work now | 530 | 632 | ||||||
| Available to work now (marginally attached) | 2,511 | 2,517 | ||||||
| Discouraged over job prospects | 1,037 | 802 | ||||||
| Reasons other than discouragement | 1,474 | 1,715 | ||||||
| Family responsibilities | 180 | 244 | ||||||
| In school or training | 314 | 329 | ||||||
| Ill health or disability | 121 | 177 | ||||||
So from the above table, we can see how the sub-sets work. Of the 88.6 million not in the labor force in September 2012, 82.2 million do not want a job, i.e., they are retired, stay-at-home moms, students, etc. That leaves 6.4 million that do want a job. Of those, 3.2 million didn’t even look in the last 12 months. Of those that have looked for a job, but not in the previous four weeks, 632 thousand are not really available to work. That leaves 2.5 million who are theoretically available to work. But of those, 1.7 million aren’t available to work because they have family responsibilities, are in school, or are disabled.
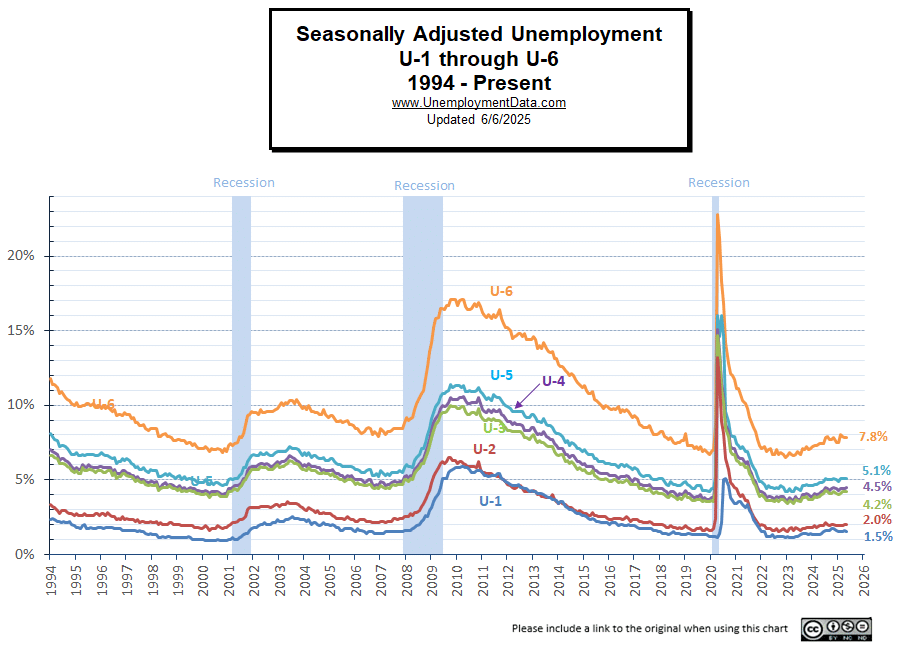
Chart of U1 through U6 Unemployment Rates
U1 is the Percentage of the labor force unemployed for 15 weeks or longer.
U2 is the Percentage of the labor force who lost jobs or completed temporary work.
U3 is the Official unemployment rate per the International Labor Organization definition. It occurs when people are without jobs and have actively looked for work within the past four weeks.
U4 is U3 + “discouraged workers,” i.e., those who have stopped looking for work because current economic conditions make them believe that no work is available for them.
U5 is U4 + other “marginally attached workers”, or “loosely attached workers”, or those who “would like” and can work but have not looked for work recently.
U6 is U5 + Part-time workers who want to work full-time but cannot due to economic reasons, i.e., the economy is bad, so their employer cut their hours, and they can’t find other work.
Data Tables are available from the U.S. Bureau of Labor Statistics for U1 – U6.
John William’s Shadowstats tells us that “long-term discouraged workers were defined out of official existence in 1994.” The new U-6 numbers only include short-term discouraged workers. So they have developed an alternative measure estimating what they believe to be the real unemployment rate based on the pre-1994 system of measurement.
See Also:
- Is the Government Fudging the numbers?
- What Is U-6 Unemployment?
- Current Employment vs. Unemployment Chart
- Employment vs. Unemployment – Two sides of the same coin?
- 7 Tips for the Newly Unemployed
Source: U.S. Bureau of Labor Statistics- Household Data Not Seasonally Adjusted- Persons not in the labor force
Photo Credits: By billsoPHOTO | No We’re Not Hiring


Is there a U7?
High-skilled who took a low pay job to pay the bills? It doesn’t seem like these are included in any of these numbers but do show a lot of weakness in the economy if we are not able to successfully use our labor force.
Tommie,
There isn’t an official U-7 but you certainly have a good point there are a lot of “underemployed” people who are qualified for higher skilled jobs but can’t find them. A major problem with the current “recovery” is that high paying jobs are being replaced with lower paying jobs. So even though the people are working they aren’t earning what they used to prior to the 2008 crash..