
Unemployment Rate (in Table Form)
 The U.S. Bureau of Labor Statistics (BLS) has been tracking the unemployment rate since 1948.
In the 1970s, an era of high inflation and unemployment, Julius Shiskin, the Commissioner of the Bureau of Labor Statistics (BLS), was receiving criticism of the unemployment numbers because “the figures are used to gauge more than just joblessness”. For many, the unemployment numbers served as a yardstick for assessing the number of persons who experience some level of “financial hardship”. In response, he developed a range of unemployment indicators known as U-1 through U-6.
This change allowed the BLS to set the official unemployment rate as U3, a much lower number than the U6, thus much more politically expedient.
- U1: Percentage of labor force unemployed 15 weeks or longer.
- U2: Percentage of the labor force who lost jobs or completed temporary work.
- U3: The Official unemployment rate- when people are without jobs and have actively looked for work within the past four weeks.
- U4: U3 + “discouraged workers”, or those who have stopped looking for work because current economic conditions make them believe that no job is available for them.
- U5: U4 + other “marginally attached workers”, or “loosely attached workers”, or those who “would like” and are able to work but have not looked for work recently.
- U6: U5 + Part-time workers who want to work full-time but cannot due to economic reasons (underemployment).
Then in 1994, according to Shadowstats, the government really began underestimating unemployment by defining “long-term discouraged workers out of official existence.” The new U-6 numbers only include short-term discouraged workers.
Jump to:
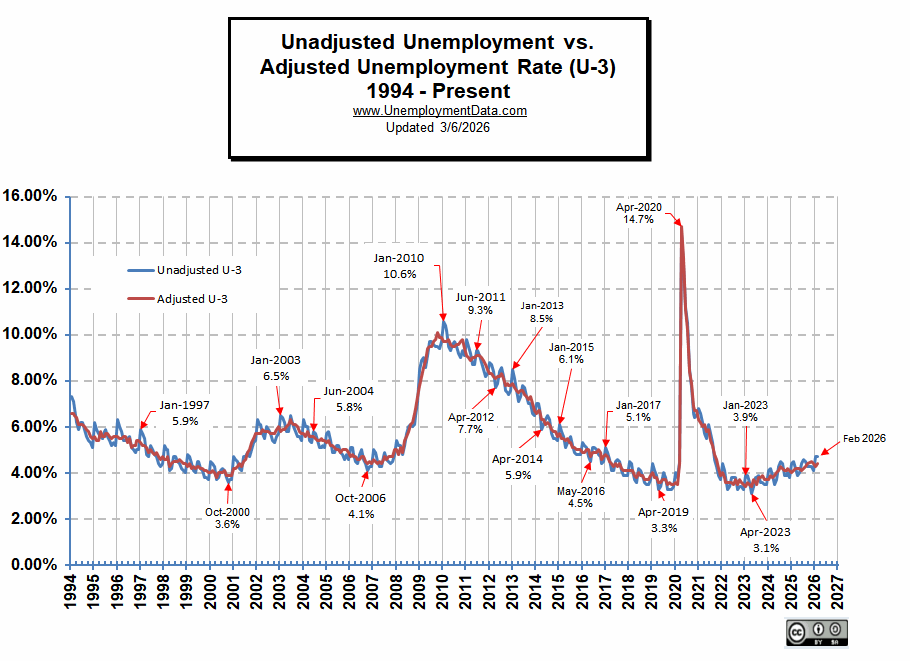
Unadjusted vs. Adjusted U-3 Unemployment Rate Chart
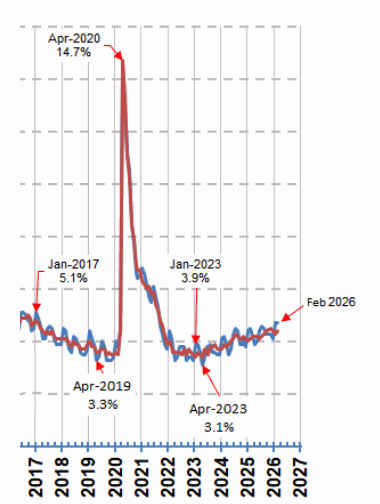
 Closeup
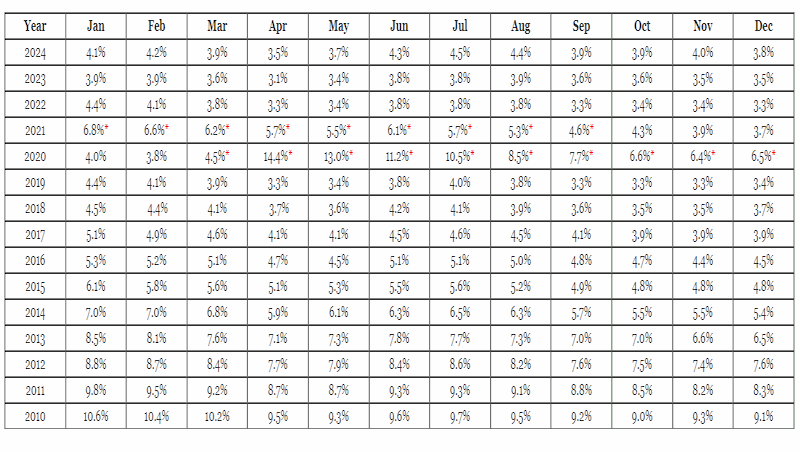
 Unadjusted Unemployment Rate Table
* Beginning in March 2020, the economy effectively shut down due to “social distancing” to prevent the spread of the Coronavirus. This resulted in a spike in the unemployment rate.
**Data Not Available due to Government Shutdown
*Data adjusted due to Population Adjustments
This table shows Unadjusted U-3 Monthly Unemployment Rates from 1948 through the present:
| Year | Jan | Feb | Mar | Apr | May | Jun | Jul | Aug | Sep | Oct | Nov | Dec |
| 2026 | 4.7%* | 4.7% | ||||||||||
| 2025 | 4.4% | 4.5% | 4.2% | 3.9% | 4.0% | 4.4% | 4.6% | 4.5% | 4.3% | NA** | 4.3% | 4.1% |
| 2024 | 4.1% | 4.2% | 3.9% | 3.5% | 3.7% | 4.3% | 4.5% | 4.4% | 3.9% | 3.9% | 4.0% | 3.8% |
| 2023 | 3.9% | 3.9% | 3.6% | 3.1% | 3.4% | 3.8% | 3.8% | 3.9% | 3.6% | 3.6% | 3.5% | 3.5% |
| 2022 | 4.4% | 4.1% | 3.8% | 3.3% | 3.4% | 3.8% | 3.8% | 3.8% | 3.3% | 3.4% | 3.4% | 3.3% |
| 2021 | 6.8%* | 6.6%* | 6.2%* | 5.7%* | 5.5%* | 6.1%* | 5.7%* | 5.3%* | 4.6%* | 4.3% | 3.9% | 3.7% |
| 2020 | 4.0% | 3.8% | 4.5%* | 14.4%* | 13.0%* | 11.2%* | 10.5%* | 8.5%* | 7.7%* | 6.6%* | 6.4%* | 6.5%* |
| 2019 | 4.4% | 4.1% | 3.9% | 3.3% | 3.4% | 3.8% | 4.0% | 3.8% | 3.3% | 3.3% | 3.3% | 3.4% |
| 2018 | 4.5% | 4.4% | 4.1% | 3.7% | 3.6% | 4.2% | 4.1% | 3.9% | 3.6% | 3.5% | 3.5% | 3.7% |
| 2017 | 5.1% | 4.9% | 4.6% | 4.1% | 4.1% | 4.5% | 4.6% | 4.5% | 4.1% | 3.9% | 3.9% | 3.9% |
| 2016 | 5.3% | 5.2% | 5.1% | 4.7% | 4.5% | 5.1% | 5.1% | 5.0% | 4.8% | 4.7% | 4.4% | 4.5% |
| 2015 | 6.1% | 5.8% | 5.6% | 5.1% | 5.3% | 5.5% | 5.6% | 5.2% | 4.9% | 4.8% | 4.8% | 4.8% |
| 2014 | 7.0% | 7.0% | 6.8% | 5.9% | 6.1% | 6.3% | 6.5% | 6.3% | 5.7% | 5.5% | 5.5% | 5.4% |
| 2013 | 8.5% | 8.1% | 7.6% | 7.1% | 7.3% | 7.8% | 7.7% | 7.3% | 7.0% | 7.0% | 6.6% | 6.5% |
| 2012 | 8.8% | 8.7% | 8.4% | 7.7% | 7.9% | 8.4% | 8.6% | 8.2% | 7.6% | 7.5% | 7.4% | 7.6% |
| 2011 | 9.8% | 9.5% | 9.2% | 8.7% | 8.7% | 9.3% | 9.3% | 9.1% | 8.8% | 8.5% | 8.2% | 8.3% |
| 2010 | 10.6% | 10.4% | 10.2% | 9.5% | 9.3% | 9.6% | 9.7% | 9.5% | 9.2% | 9.0% | 9.3% | 9.1% |
| 2009 | 8.5% | 8.9% | 9.0% | 8.6% | 9.1% | 9.7% | 9.7% | 9.6% | 9.5% | 9.5% | 9.4% | 9.7% |
| 2008 | 5.4% | 5.2% | 5.2% | 4.8% | 5.2% | 5.7% | 6.0% | 6.1% | 6.0% | 6.1% | 6.5% | 7.1% |
| 2007 | 5.0% | 4.9% | 4.5% | 4.3% | 4.3% | 4.7% | 4.9% | 4.6% | 4.5% | 4.4% | 4.5% | 4.8% |
| 2006 | 5.1% | 5.1% | 4.8% | 4.5% | 4.4% | 4.8% | 5.0% | 4.6% | 4.4% | 4.1% | 4.3% | 4.3% |
| 2005 | 5.7% | 5.8% | 5.4% | 4.9% | 4.9% | 5.2% | 5.2% | 4.9% | 4.8% | 4.6% | 4.8% | 4.6% |
| 2004 | 6.3% | 6.0% | 6.0% | 5.4% | 5.3% | 5.8% | 5.7% | 5.4% | 5.1% | 5.1% | 5.2% | 5.1% |
| 2003 | 6.5% | 6.4% | 6.2% | 5.8% | 5.8% | 6.5% | 6.3% | 6.0% | 5.8% | 5.6% | 5.6% | 5.4% |
| 2002 | 6.3% | 6.1% | 6.1% | 5.7% | 5.5% | 6.0% | 5.9% | 5.7% | 5.4% | 5.3% | 5.6% | 5.7% |
| 2001 | 4.7% | 4.6% | 4.5% | 4.2% | 4.1% | 4.7% | 4.7% | 4.9% | 4.7% | 5.0% | 5.3% | 5.4% |
| 2000 | 4.5% | 4.4% | 4.3% | 3.7% | 3.8% | 4.1% | 4.2% | 4.1% | 3.8% | 3.6% | 3.7% | 3.7% |
| 1999 | 4.8% | 4.7% | 4.4% | 4.1% | 4.0% | 4.5% | 4.5% | 4.2% | 4.1% | 3.8% | 3.8% | 3.7% |
| 1998 | 5.2% | 5.0% | 5.0% | 4.1% | 4.2% | 4.7% | 4.7% | 4.5% | 4.4% | 4.2% | 4.1% | 4.0% |
| 1997 | 5.9% | 5.7% | 5.5% | 4.8% | 4.7% | 5.2% | 5.0% | 4.8% | 4.7% | 4.4% | 4.3% | 4.4% |
| 1996 | 6.3% | 6.0% | 5.8% | 5.4% | 5.4% | 5.5% | 5.6% | 5.1% | 5.0% | 4.9% | 5.0% | 5.0% |
| 1995 | 6.2% | 5.9% | 5.7% | 5.6% | 5.5% | 5.8% | 5.9% | 5.6% | 5.4% | 5.2% | 5.3% | 5.2% |
| 1994 | 7.3% | 7.1% | 6.8% | 6.2% | 5.9% | 6.2% | 6.2% | 5.9% | 5.6% | 5.4% | 5.3% | 5.1% |
| 1993 | 8.0% | 7.8% | 7.4% | 6.9% | 6.8% | 7.2% | 7.0% | 6.6% | 6.4% | 6.4% | 6.2% | 6.1% |
| 1992 | 8.1% | 8.2% | 7.8% | 7.2% | 7.3% | 8.0% | 7.7% | 7.4% | 7.3% | 6.9% | 7.1% | 7.1% |
| 1991 | 7.1% | 7.3% | 7.2% | 6.5% | 6.7% | 7.0% | 6.8% | 6.6% | 6.5% | 6.5% | 6.7% | 6.9% |
| 1990 | 6.0% | 5.9% | 5.5% | 5.3% | 5.2% | 5.4% | 5.6% | 5.5% | 5.6% | 5.5% | 5.9% | 6.0% |
| 1989 | 6.0% | 5.6% | 5.2% | 5.1% | 5.0% | 5.5% | 5.3% | 5.1% | 5.1% | 5.0% | 5.2% | 5.1% |
| 1988 | 6.3% | 6.2% | 5.9% | 5.3% | 5.4% | 5.5% | 5.5% | 5.4% | 5.2% | 5.0% | 5.2% | 5.0% |
| 1987 | 7.3% | 7.2% | 6.9% | 6.2% | 6.1% | 6.3% | 6.1% | 5.8% | 5.7% | 5.7% | 5.6% | 5.4% |
| 1986 | 7.3% | 7.8% | 7.5% | 7.0% | 7.0% | 7.3% | 7.0% | 6.7% | 6.8% | 6.6% | 6.6% | 6.3% |
| 1985 | 8.0% | 7.8% | 7.5% | 7.1% | 7.0% | 7.5% | 7.4% | 6.9% | 6.9% | 6.8% | 6.7% | 6.7% |
| 1984 | 8.8% | 8.4% | 8.1% | 7.6% | 7.2% | 7.4% | 7.5% | 7.3% | 7.1% | 7.0% | 6.9% | 7.0% |
| 1983 | 11.4% | 11.3% | 10.8% | 10.0% | 9.8% | 10.2% | 9.4% | 9.2% | 8.8% | 8.4% | 8.1% | 8.0% |
| 1982 | 9.4% | 9.6% | 9.5% | 9.2% | 9.1% | 9.8% | 9.8% | 9.6% | 9.7% | 9.9% | 10.4% | 10.5% |
| 1981 | 8.2% | 8.0% | 7.7% | 7.0% | 7.1% | 7.7% | 7.3% | 7.2% | 7.3% | 7.5% | 7.9% | 8.3% |
| 1980 | 6.9% | 6.8% | 6.6% | 6.7% | 7.1% | 7.8% | 7.9% | 7.6% | 7.2% | 7.1% | 7.1% | 6.9% |
| 1979 | 6.4% | 6.4% | 6.1% | 5.5% | 5.2% | 6.0% | 5.9% | 5.9% | 5.7% | 5.6% | 5.6% | 5.7% |
| 1978 | 7.1% | 6.9% | 6.6% | 5.8% | 5.5% | 6.2% | 6.3% | 5.9% | 5.8% | 5.4% | 5.6% | 5.7% |
| 1977 | 8.3% | 8.5% | 7.9% | 6.9% | 6.4% | 7.5% | 7.0% | 6.8% | 6.6% | 6.4% | 6.5% | 6.0% |
| 1976 | 8.8% | 8.7% | 8.1% | 7.4% | 6.8% | 8.0% | 7.8% | 7.6% | 7.4% | 7.2% | 7.4% | 7.4% |
| 1975 | 9.0% | 9.1% | 9.1% | 8.6% | 8.3% | 9.1% | 8.7% | 8.2% | 8.1% | 7.8% | 7.8% | 7.8% |
| 1974 | 5.7% | 5.8% | 5.3% | 4.8% | 4.6% | 5.8% | 5.7% | 5.3% | 5.7% | 5.5% | 6.2% | 6.7% |
| 1973 | 5.5% | 5.6% | 5.2% | 4.8% | 4.4% | 5.4% | 5.0% | 4.7% | 4.7% | 4.2% | 4.6% | 4.6% |
| 1972 | 6.5% | 6.4% | 6.1% | 5.5% | 5.1% | 6.2% | 5.9% | 5.5% | 5.4% | 5.1% | 4.9% | 4.8% |
| 1971 | 6.6% | 6.6% | 6.3% | 5.7% | 5.3% | 6.5% | 6.2% | 5.9% | 5.8% | 5.4% | 5.7% | 5.5% |
| 1970 | 4.2% | 4.7% | 4.6% | 4.3% | 4.1% | 5.6% | 5.3% | 5.0% | 5.2% | 5.1% | 5.5% | 5.6% |
| 1969 | 3.7% | 3.7% | 3.5% | 3.2% | 2.9% | 4.1% | 3.8% | 3.5% | 3.7% | 3.5% | 3.3% | 3.2% |
| 1968 | 4.0% | 4.2% | 3.8% | 3.2% | 2.9% | 4.5% | 4.0% | 3.5% | 3.3% | 3.2% | 3.3% | 3.1% |
| 1967 | 4.2% | 4.2% | 3.9% | 3.5% | 3.2% | 4.6% | 4.1% | 3.7% | 3.7% | 3.8% | 3.7% | 3.5% |
| 1966 | 4.4% | 4.2% | 4.0% | 3.6% | 3.7% | 4.6% | 3.9% | 3.6% | 3.3% | 3.2% | 3.4% | 3.5% |
| 1965 | 5.5% | 5.7% | 5.1% | 4.7% | 4.3% | 5.3% | 4.5% | 4.2% | 3.8% | 3.6% | 3.9% | 3.7% |
| 1964 | 6.4% | 6.2% | 5.9% | 5.3% | 4.8% | 5.9% | 4.9% | 4.8% | 4.5% | 4.4% | 4.5% | 4.7% |
| 1963 | 6.6% | 6.9% | 6.3% | 5.6% | 5.5% | 6.2% | 5.6% | 5.2% | 4.8% | 4.7% | 5.3% | 5.3% |
| 1962 | 6.7% | 6.5% | 6.2% | 5.5% | 5.1% | 5.9% | 5.3% | 5.3% | 4.9% | 4.5% | 5.3% | 5.3% |
| 1961 | 7.7% | 8.1% | 7.7% | 7.0% | 6.6% | 7.3% | 6.9% | 6.2% | 5.8% | 5.5% | 5.6% | 5.8% |
| 1960 | 6.1% | 5.7% | 6.1% | 5.2% | 4.8% | 5.8% | 5.5% | 5.2% | 4.7% | 5.0% | 5.6% | 6.4% |
| 1959 | 7.0% | 7.0% | 6.4% | 5.2% | 4.9% | 5.4% | 5.2% | 4.8% | 4.7% | 4.7% | 5.3% | 5.1% |
| 1958 | 6.8% | 7.7% | 7.7% | 7.5% | 7.1% | 7.6% | 7.4% | 6.7% | 6.0% | 5.5% | 5.6% | 6.0% |
| 1957 | 4.9% | 4.7% | 4.3% | 4.0% | 3.9% | 4.6% | 4.1% | 3.7% | 3.7% | 3.6% | 4.6% | 5.0% |
| 1956 | 4.7% | 4.8% | 4.7% | 4.1% | 4.2% | 4.7% | 4.4% | 3.7% | 3.4% | 3.1% | 3.9% | 4.0% |
| 1955 | 5.8% | 5.7% | 5.2% | 4.9% | 4.2% | 4.4% | 4.0% | 3.8% | 3.5% | 3.4% | 3.8% | 3.9% |
| 1954 | 5.7% | 6.3% | 6.4% | 6.1% | 5.7% | 5.7% | 5.7% | 5.4% | 5.3% | 4.6% | 4.9% | 4.8% |
| 1953 | 3.4% | 3.2% | 2.9% | 2.8% | 2.5% | 2.7% | 2.7% | 2.4% | 2.6% | 2.5% | 3.2% | 4.2% |
| 1952 | 3.7% | 3.8% | 3.3% | 3.0% | 2.9% | 3.2% | 3.3% | 3.1% | 2.7% | 2.4% | 2.5% | 2.5% |
| 1951 | 4.4% | 4.2% | 3.8% | 3.2% | 2.9% | 3.4% | 3.3% | 2.9% | 3.0% | 2.8% | 3.2% | 2.9% |
| 1950 | 7.6% | 7.9% | 7.1% | 6.0% | 5.3% | 5.6% | 5.3% | 4.1% | 4.0% | 3.3% | 3.8% | 3.9% |
| 1949 | 5.0% | 5.8% | 5.6% | 5.4% | 5.7% | 6.4% | 7.0% | 6.3% | 5.9% | 6.1% | 5.7% | 6.0% |
| 1948 | 4.0% | 4.7% | 4.5% | 4.0% | 3.4% | 3.9% | 3.9% | 3.6% | 3.4% | 2.9% | 3.3% | 3.6% |
Seasonally Adjusted Unemployment Rate Table
This table shows Seasonally Adjusted U-3 Monthly Unemployment Rates from 1948 through the present:
In December 2022, the BLS changed its Seasonal adjustment algorithm, supposedly only affecting data back to 2018. Changed (updated) numbers are in Yellow.
Here is their statement:
Revision of Seasonally Adjusted Household Survey Data
At the end of each calendar year, BLS updates the seasonal adjustment factors for the national labor force series derived from the household survey. As a result of this process, in 2023, seasonally adjusted data for January 2018 through November 2022 were subject to revision. (Not seasonally adjusted data were not subject to revision.)
Note: You can see the 2023 changes in Yellow, and there were changes 10 years further back than the stated 2018. And the change for October 2010 was more than the typical 1/10th% adjustment.
| Year | Jan | Feb | Mar | Apr | May | Jun | Jul | Aug | Sep | Oct | Nov | Dec |
| 2026 | 4.3% | 4.4% | ||||||||||
| 2025 | 4.0% | 4.1% | 4.2% | 4.2% | 4.2% | 4.1% | 4.2% | 4.3% | 4.4% | NA** | 4.5% | 4.4% |
| 2024 | 3.7% | 3.9% | 3.8% | 3.9% | 4.0% | 4.1% | 4.3% | 4.2% | 4.1% | 4.1% | 4.2% | 4.1% |
| 2023 | 3.4% | 3.6% | 3.5% | 3.5% | 3.7% | 3.6% | 3.5% | 3.8% | 3.8% | 3.9% | 3.7% | 3.7% |
| 2022 | 4.0% | 3.8% | 3.6% | 3.6% | 3.6% | 3.6% | 3.5% | 3.7% | 3.5% | 3.7% | 3.7% 3.6% |
3.5% |
| 2021 | 6.3% | 6.2% | 6.0% 6.1% |
6.1% | 5.8% | 5.9% | 5.4% | 5.2% | 4.8% | 4.6% 4.5% |
4.2% | 3.9% |
| 2020 | 3.6% 3.5% |
3.5% | 4.4% | 14.7% | 13.3% 13.2% |
11.1% 11.0% |
10.2% | 8.4% | 7.9% | 6.9% | 6.7% | 6.7% |
| 2019 | 4.0% | 3.8% | 3.8% | 3.6% | 3.6% 3.7% |
3.7% 3.6% |
3.7% | 3.7% | 3.5% | 3.6% | 3.5% 3.6% |
3.5% 3.6% |
| 2018 | 4.1% 4.0% |
4.1% | 4.1% 4.0% |
3.9% 4.0% |
3.8% | 4.0% | 3.9% 3.8% |
3.9% 3.8% |
3.7% | 3.7% 3.8% |
3.7% 3.8% |
3.9% |
| 2017 | 4.8% 4.7% |
4.7% 4.6% |
4.5% 4.4% |
4.4% |
4.3% 4.4% |
4.4% 4.3% |
4.3% | 4.4% | 4.2% 4.3% |
4.1% 4.2% |
4.1% 4.2% |
4.1% |
| 2016 | 4.9% 4.8% |
4.9% | 5.0% | 5.0% 5.1% |
4.7% 4.8% |
4.9% | 4.9% 4.8% |
4.9% | 5.0% | 4.9% | 4.6% 4.7% |
4.7% |
| 2015 | 5.7% | 5.5% | 5.5% 5.4% |
5.4% | 5.5% 5.6% |
5.3% | 5.3% 5.2% |
5.1% | 5.1% 5.0% |
5.0% | 5.0% 5.1% |
5.0% |
| 2014 | 6.6% | 6.7% | 6.7% | 6.3% 6.2% |
6.3% | 6.1% | 6.2% | 6.1% | 5.9% | 5.8% 5.7% |
5.8% | 5.6% |
| 2013 | 7.9% 8.0% |
7.7% | 7.6% 7.5% |
7.5% 7.6% |
7.6% 7.5% |
7.6% 7.5% |
7.4% 7.3% |
7.3% 7.2% |
7.2% | 7.3% 7.2% |
7.0% 6.9% |
6.7% |
| 2012 | 8.3% | 8.3% | 8.2% | 8.1% 8.2% |
8.2% | 8.2% | 8.3% 8.2% |
8.1% | 7.8% | 7.9% 7.8% |
7.8% 7.7% |
7.8% 7.9% |
| 2011 | 9.0% 9.1% |
9.0% | 8.9% 9.0% |
9.0% 9.1% |
9.0% | 9.1% | 9.1% 9.0% |
9.1% 9.0% |
9.0% | 8.9% 8.8% |
8.7% 8.6% |
8.5% |
| 2010 | 9.7% 9.8% |
9.7% 9.8% |
9.7% 9.9% |
9.8% 9.9% |
9.6% | 9.5% 9.4% |
9.5% 9.4% |
9.6% 9.5% |
9.6% 9.5% |
9.7% 9.4% |
9.8% | 9.4% 9.3% |
| 2009 | 7.8% | 8.2% 8.3% |
8.6% 8.7% |
8.9% 9.0% |
9.4% | 9.5% | 9.5% | 9.7% 9.6% |
9.8% | 10.1% 10.0% |
9.9% | 9.9% |
| 2008 | 5.0% | 4.8% 4.9% |
5.1% | 4.9% 5.0% |
5.4% | 5.6% | 5.8% | 6.1% | 6.2% 6.1% |
6.6% 6.5% |
6.8% | 7.3% |
| 2007 | 4.6% |
4.5% | 4.4% | 4.5% | 4.4% | 4.6% | 4.7% | 4.6% | 4.7% | 4.7% | 4.7% | 5.0% |
| 2006 | 4.0% | 4.8% | 4.7% | 4.7% | 4.6% | 4.6% | 4.7% | 4.7% | 4.5% | 4.4% | 4.5% | 4.4% |
| 2005 | 5.3% | 5.4% | 5.2% | 5.2% | 5.1% | 5.0% | 5.0% | 4.9% | 5.0% | 5.0% | 5.0% | 4.9% |
| 2004 | 5.7% | 5.6% | 5.8% | 5.6% | 5.6% | 5.6% | 5.5% | 5.4% | 5.4% | 5.5% | 5.4% | 5.4% |
| 2003 | 5.8% | 5.9% | 5.9% | 6.0% | 6.1% | 6.3% | 6.2% | 6.1% | 6.1% | 6.0% | 5.8% | 5.7% |
| 2002 | 5.7% | 5.7% | 5.7% | 5.9% | 5.8% | 5.8% | 5.8% | 5.7% | 5.7% | 5.7% | 5.9% | 6.0% |
| 2001 | 4.2% | 4.2% | 4.3% | 4.4% | 4.3% | 4.5% | 4.6% | 4.9% | 5.0% | 5.3% | 5.5% | 5.7% |
| 2000 | 4.0% | 4.1% | 4.0% | 3.8% | 4.0% | 4.0% | 4.0% | 4.1% | 3.9% | 3.9% | 3.9% | 3.9% |
| 1999 | 4.3% | 4.4% | 4.2% | 4.3% | 4.2% | 4.3% | 4.3% | 4.2% | 4.2% | 4.1% | 4.1% | 4.0% |
| 1998 | 4.6% | 4.6% | 4.7% | 4.3% | 4.4% | 4.5% | 4.5% | 4.5% | 4.6% | 4.5% | 4.40 | 4.4% |
| 1997 | 5.3% | 5.2% | 5.2% | 5.1% | 4.9% | 5.0% | 4.9% | 4.8% | 4.9% | 4.7% | 4.6% | 4.7% |
| 1996 | 5.6% | 5.5% | 5.5% | 5.6% | 5.6% | 5.3% | 5.5% | 5.1% | 5.2% | 5.2% | 5.4% | 5.4% |
| 1995 | 5.6% | 5.4% | 5.4% | 5.8% | 5.6% | 5.6% | 5.7% | 5.7% | 5.6% | 5.5% | 5.6% | 5.6% |
| 1994 | 6.6% | 6.6% | 6.5% | 6.4% | 6.1% | 6.1% | 6.1% | 6.0% | 5.9% | 5.8% | 5.6% | 5.5% |
| 1993 | 7.3% | 7.1% | 7.0% | 7.1% | 7.1% | 7.0% | 6.9% | 6.8% | 6.7% | 6.8% | 6.6% | 6.5% |
| 1992 | 7.3% | 7.4% | 7.4% | 7.4% | 7.6% | 7.8% | 7.7% | 7.6% | 7.6% | 7.3% | 7.4% | 7.4% |
| 1991 | 6.4% | 6.6% | 6.8% | 6.7% | 6.9% | 6.9% | 6.8% | 6.9% | 6.9% | 7.0% | 7.0% | 7.3% |
| 1990 | 5.4% | 5.3% | 5.2% | 5.4% | 5.4% | 5.2% | 5.5% | 5.7% | 5.9% | 5.9% | 6.2% | 6.3% |
| 1989 | 5.4% | 5.2% | 5.0% | 5.2% | 5.2% | 5.3% | 5.2% | 5.2% | 5.3% | 5.3% | 5.4% | 5.4% |
| 1988 | 5.7% | 5.7% | 5.7% | 5.40% | 5.6% | 5.4% | 5.4% | 5.6% | 5.4% | 5.4% | 5.3% | 5.3% |
| 1987 | 6.6% | 6.6% | 6.6% | 6.3% | 6.3% | 6.2% | 6.1% | 6.0% | 5.9% | 6.0% | 5.8% | 5.7% |
| 1986 | 6.7% | 7.2% | 7.2% | 7.1% | 7.2% | 7.2% | 7.0% | 6.9% | 7.0% | 7.0% | 6.9% | 6.6% |
| 1985 | 7.3% | 7.2% | 7.2% | 7.3% | 7.2% | 7.4% | 7.4% | 7.1% | 7.1% | 7.1% | 7.0% | 7.0% |
| 1984 | 8.0% | 7.8% | 7.8% | 7.7% | 7.4% | 7.2% | 7.5% | 7.5% | 7.3% | 7.4% | 7.2% | 7.3% |
| 1983 | 10.4% | 10.4% | 10.3% | 10.2% | 10.1% | 10.1% | 9.4% | 9.5% | 9.2% | 8.8% | 8.50 | 8.3% |
| 1982 | 8.6% | 8.9% | 9.0% | 9.3% | 9.4% | 9.6% | 9.8% | 9.8% | 10.1% | 10.4% | 10.8% | 10.8% |
| 1981 | 7.5% | 7.4% | 7.4% | 7.2% | 7.5% | 7.5% | 7.2% | 7.4% | 7.6% | 7.9% | 8.3% | 8.5% |
| 1980 | 6.3% | 6.3% | 6.3% | 6.9% | 7.5% | 7.6% | 7.8% | 7.7% | 7.5% | 7.5% | 7.5% | 7.2% |
| 1979 | 5.9% | 5.9% | 5.8% | 5.8% | 5.6% | 5.7% | 5.7% | 6.0% | 5.9% | 6.0% | 5.9% | 6.0% |
| 1978 | 6.4% | 6.3% | 6.3% | 6.1% | 6.0% | 5.9% | 6.2% | 5.9% | 6.0% | 5.8% | 5.9% | 6.0% |
| 1977 | 7.5% | 7.6% | 7.4% | 7.2% | 7.0% | 7.2% | 6.9% | 7.0% | 6.8% | 6.8% | 6.8% | 6.4% |
| 1976 | 7.9% | 7.7% | 7.6% | 7.7% | 7.4% | 7.6% | 7.8% | 7.8% | 7.6% | 7.7% | 7.8% | 7.8% |
| 1975 | 8.1% | 8.1% | 8.6% | 8.8% | 9.0% | 8.8% | 8.6% | 8.4% | 8.4% | 8.4% | 8.3% | 8.2% |
| 1974 | 5.1% | 5.2% | 5.1% | 5.1% | 5.1% | 5.4% | 5.5% | 5.5% | 5.9% | 6.0% | 6.6% | 7.2% |
| 1973 | 4.9% | 5.0% | 4.9% | 5.0% | 4.9% | 4.9% | 4.8% | 4.8% | 4.8% | 4.6% | 4.8% | 4.9% |
| 1972 | 5.8% | 5.7% | 5.8% | 5.7% | 5.7% | 5.7% | 5.6% | 5.6% | 5.5% | 5.6% | 5.3% | 5.2% |
| 1971 | 5.9% | 5.9% | 6.0% | 5.9% | 5.9% | 5.9% | 6.0% | 6.1% | 6.0% | 5.8% | 6.0% | 6.0% |
| 1970 | 3.9% | 4.2% | 4.4% | 4.6% | 4.8% | 4.9% | 5.0% | 5.1% | 5.4% | 5.5% | 5.9% | 6.1% |
| 1969 | 3.4% | 3.4% | 3.4% | 3.4% | 3.4% | 3.5% | 3.5% | 3.5% | 3.7% | 3.7% | 3.5% | 3.5% |
| 1968 | 3.7% | 3.8% | 3.7% | 3.5% | 3.5% | 3.7% | 3.7% | 3.5% | 3.4% | 3.4% | 3.4% | 3.4% |
| 1967 | 3.9% | 3.8% | 3.8% | 3.8% | 3.8% | 3.9% | 3.8% | 3.8% | 3.8% | 4.0% | 3.9% | 3.8% |
| 1966 | 4.0% | 3.8% | 3.8% | 3.8% | 3.9% | 3.8% | 3.8% | 3.8% | 3.7% | 3.7% | 3.6% | 3.8% |
| 1965 | 4.9% | 5.1% | 4.7% | 4.8% | 4.6% | 4.6% | 4.4% | 4.4% | 4.3% | 4.2% | 4.1% | 4.0% |
| 1964 | 5.6% | 5.4% | 5.4% | 5.3% | 5.1% | 5.2% | 4.9% | 5.0% | 5.1% | 5.1% | 4.8% | 5.0% |
| 1963 | 5.7% | 5.9% | 5.7% | 5.7% | 5.9% | 5.6% | 5.6% | 5.4% | 5.5% | 5.5% | 5.7% | 5.5% |
| 1962 | 5.8% | 5.5% | 5.6% | 5.6% | 5.5% | 5.5% | 5.4% | 5.7% | 5.6% | 5.4% | 5.7% | 5.5% |
| 1961 | 6.6% | 6.9% | 6.9% | 7.0% | 7.1% | 6.9% | 7.0% | 6.6% | 6.7% | 6.5% | 6.1% | 6.0% |
| 1960 | 5.2% | 4.8% | 5.4% | 5.2% | 5.1% | 5.4% | 5.5% | 5.6% | 5.5% | 6.1% | 6.1% | 6.6% |
| 1959 | 6.0% | 5.9% | 5.6% | 5.2% | 5.1% | 5.0% | 5.1% | 5.2% | 5.5% | 5.7% | 5.8% | 5.3% |
| 1958 | 5.8% | 6.4% | 6.7% | 7.4% | 7.4% | 7.3% | 7.5% | 7.4% | 7.1% | 6.7% | 6.2% | 6.2% |
| 1957 | 4.2% | 3.9% | 3.7% | 3.9% | 4.1% | 4.3% | 4.2% | 4.1% | 4.4% | 4.5% | 5.1% | 5.2% |
| 1956 | 4.0% | 3.9% | 4.2% | 4.0% | 4.3% | 4.3% | 4.4% | 4.1% | 3.9% | 3.9% | 4.3% | 4.2% |
| 1955 | 4.9% | 4.7% | 4.6% | 4.7% | 4.3% | 4.2% | 4.0% | 4.2% | 4.1% | 4.3% | 4.2% | 4.2% |
| 1954 | 4.9% | 5.2% | 5.7% | 5.9% | 5.9% | 5.6% | 5.8% | 6.0% | 6.1% | 5.7% | 5.3% | 5.0% |
| 1953 | 2.9% | 2.6% | 2.6% | 2.7% | 2.5% | 2.5% | 2.6% | 2.7% | 2.9% | 3.1% | 3.5% | 4.5% |
| 1952 | 3.2% | 3.1% | 2.9% | 2.9% | 3.0% | 3.0% | 3.2% | 3.4% | 3.1% | 3.0% | 2.8% | 2.7% |
| 1951 | 3.7% | 3.4% | 3.4% | 3.1% | 3.0% | 3.2% | 3.1% | 3.1% | 3.3% | 3.5% | 3.5% | 3.1% |
| 1950 | 6.5% | 6.4% | 6.3% | 5.8% | 5.5% | 5.4% | 5.0% | 4.5% | 4.4% | 4.2% | 4.2% | 4.3% |
| 1949 | 4.3% | 4.7% | 5.0% | 5.3% | 6.1% | 6.2% | 6.7% | 6.8% | 6.6% | 7.9% | 6.4% | 6.6% |
| 1948 | 3.4% | 3.8% | 4.0% | 3.9% | 3.5% | 3.6% | 3.6% | 3.9% | 3.8% | 3.7% | 3.8% | 4.0% |
The unemployment rate is highly correlated to the Labor Force Participation Rate. See What is the Labor Force Participation Rate? for more information.
For more information on the other measurements of the Unemployment rate, see: What is U-6 unemployment? The unemployment rate is not as accurate as of the Current Employment Data in determining how many people are actually employed.
- Unemployment Rate Chart
- Misery Index– Created by economist Arthur Okun to help gauge the level of misery the average person is suffering. It is a combination of the inflation rate and the unemployment rate.
- Is the Government Fudging Unemployment Numbers?
- Unemployment and Employment Charts
- 10 Awesome Jobs You Can Do From Home
See the Current Unemployment Rate for more information.
Source: U.S. Bureau of Labor Statistics Seasonally Adjusted Unemployment Rate
Leave a Reply