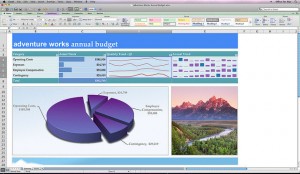
These days a critical job skill for Success in almost any position other than manual labor or minimum wage jobs is computer skills. Basic computer skills involves wordprocessing (like Microsoft Word®) or other Office Programs like MS Excel®, Powerpoint, etc. In this article we are going to look at a skill that every job seeker should have and that is using Microsoft Excel®. After learning how to enter data into rows and columns one of the next things you will want to do is create a chart using Microsoft Excel®.
Steps By Step Guide To Create a Chart/Graph in MS Excel®

Microsoft Excel® has been widely used around the world as a business application for storing, organizing and manipulating the data of the organization in a systematic format. Nowadays, the use of excel is not only restricted to business uses, but is also used by students and professionals for everything from playing music to training pilots. Despite of availability of other specific use software, people still consider using rows and columns to manage data. This is because the various features and applications offered by excel are familiar, easy to use and readily available.
One easy to use function is the creation of pie charts, graphs and other comparative presentations in Excel. To learn all the key aspects of using excel, you do not need any special training. In this article, we will tell you the step by step procedure to create graphical representations in MS Excel® 2010.
Steps to Create Charts/Graphs in MS Excel®
Step 1 – The first step is to launch Excel on your desktop. Simply click on the Start Menu > All Programs > Microsoft Office> Microsoft Excel. Now to begin your work, open a new spreadsheet. It can be done in three ways: [Read more…] about Job Skills: Excel Spreadsheets

