
By Windriven
Recovery from the Great Recession has been slow and uneven. Six years in and U3 unemployment is finally down to 5.4%, U6 has dipped below 11%. Why are there so few voices claiming victory and why do their claims ring a bit hollow?
This chart from the Federal Reserve provides a clue. It plots labor’s share – salary and wages – of Gross Domestic Product.
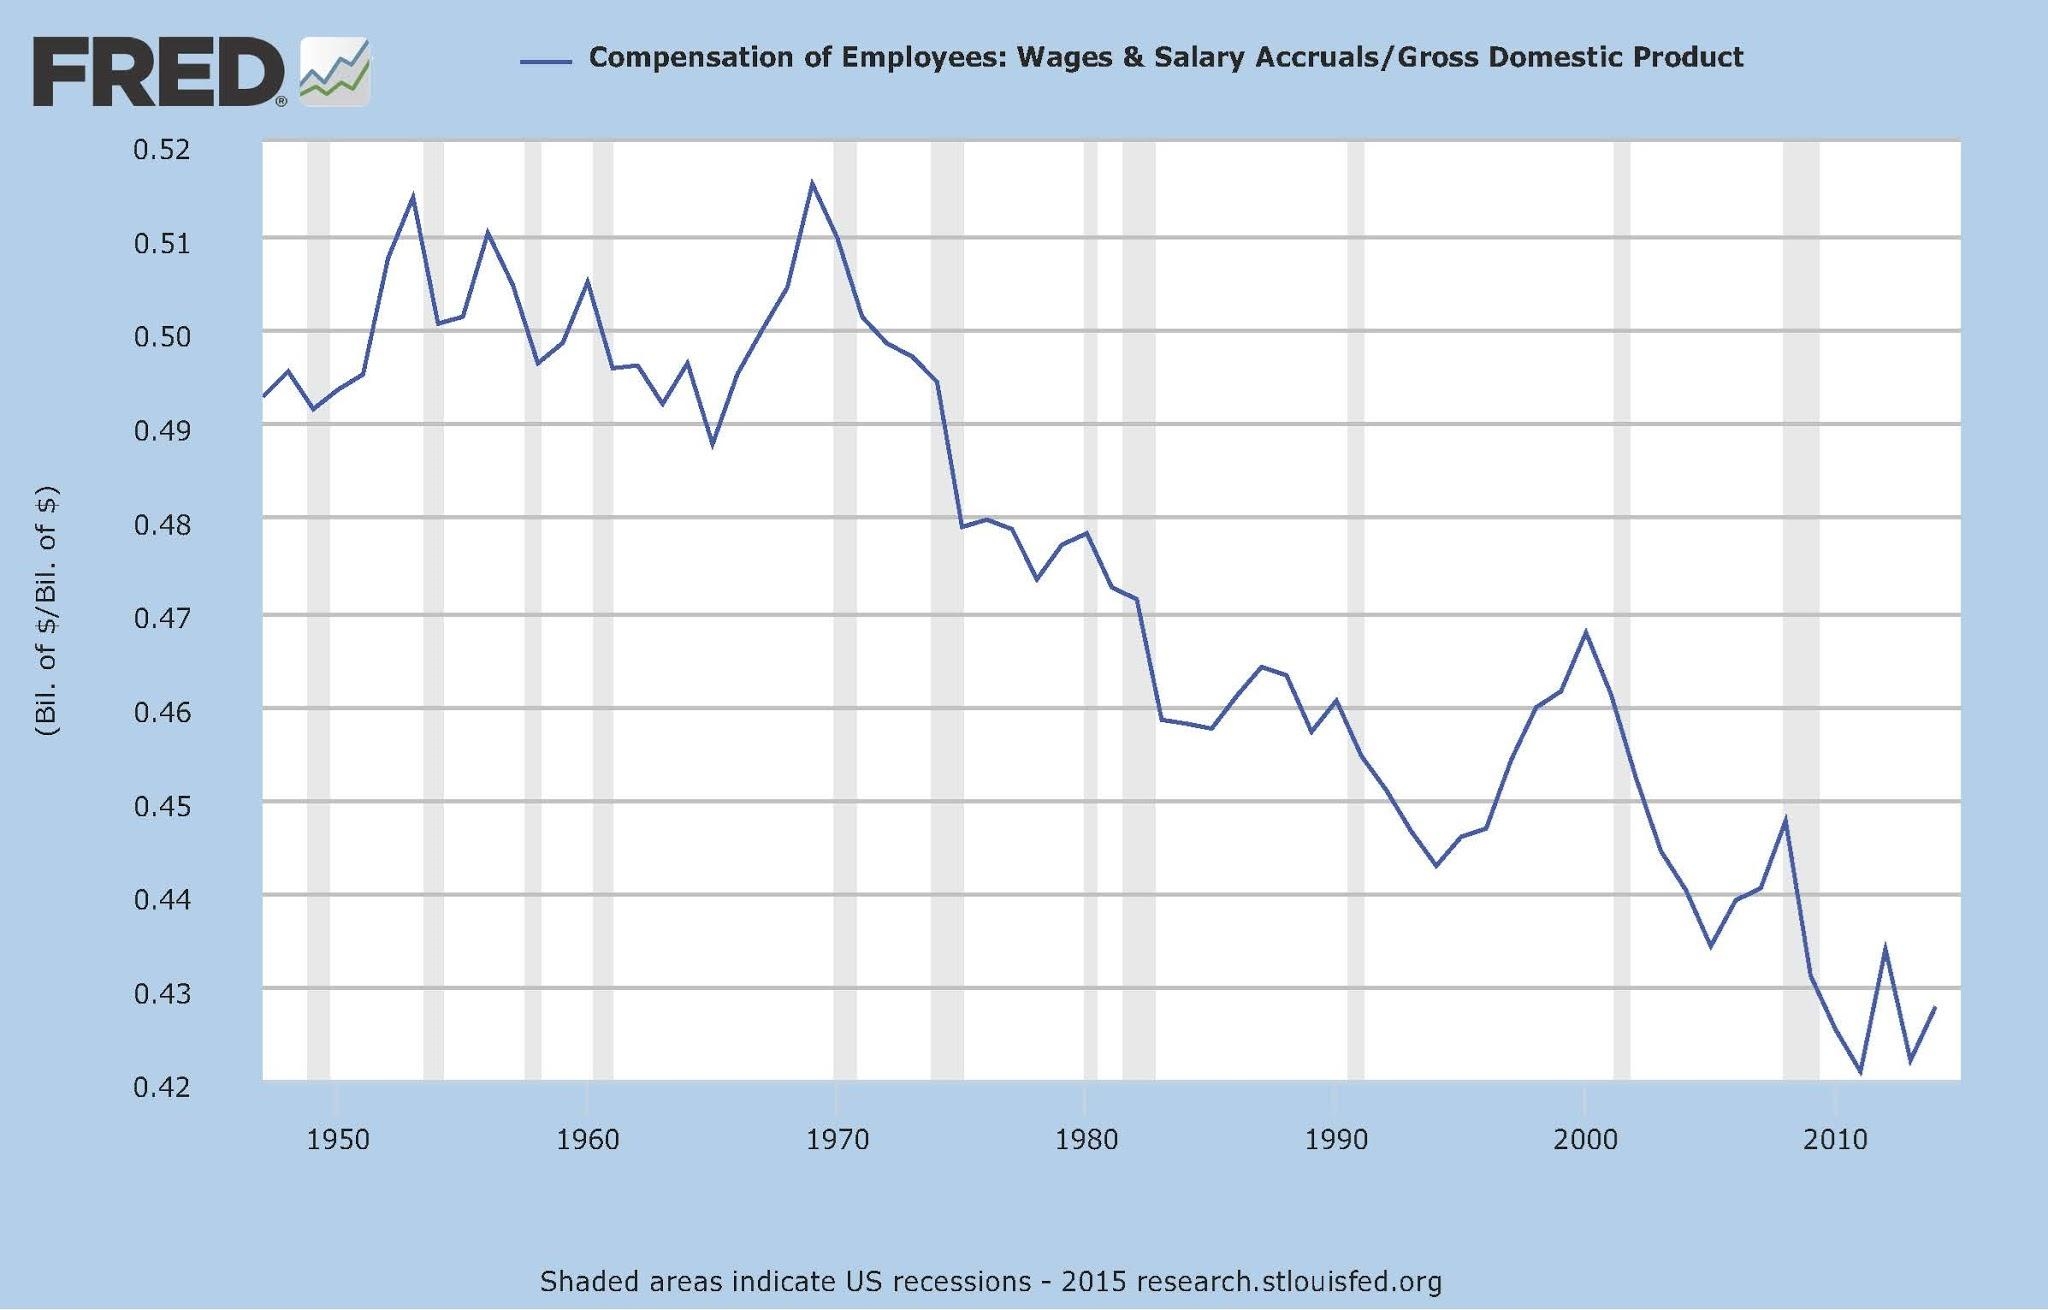
In the postwar years, the American economy was doing well. As the chart above shows, American workers’ share of GDP taken as wages and salaries was about 50% in those years. That began to change in the early 70s and today the share of GDP taken as wages and salaries is less than 43%. Productivity continued to rise. GDP continued to grow. But workers were getting a progressively smaller piece of a growing pie – and they still are today.
There are a variety of forces driving this trend. Technological change is one of those forces. Part of the continuing growth in productivity is directly attributable to automation and computerization. These technologies are capital intensive and usually labor-saving.
An even greater force is the addition of huge numbers of workers to the market economy by way of liberalization of business regulations in countries such as Mexico and India, the collapse of command economies in former Soviet Union countries, and the economic transformation of China engineered by Deng Xiaoping. By 2009, almost 100 MILLION Chinese worked in the manufacturing sector alone. At that same time, the entire US civilian workforce was only 155 million. Not only were several hundred million new workers added to the market economy workforce, these new workers came cheap. Predictably, jobs started moving from the US to these low labor rate venues. Between March 2001 and March 2007, US manufacturing shed almost 3.5 million domestic jobs(1).
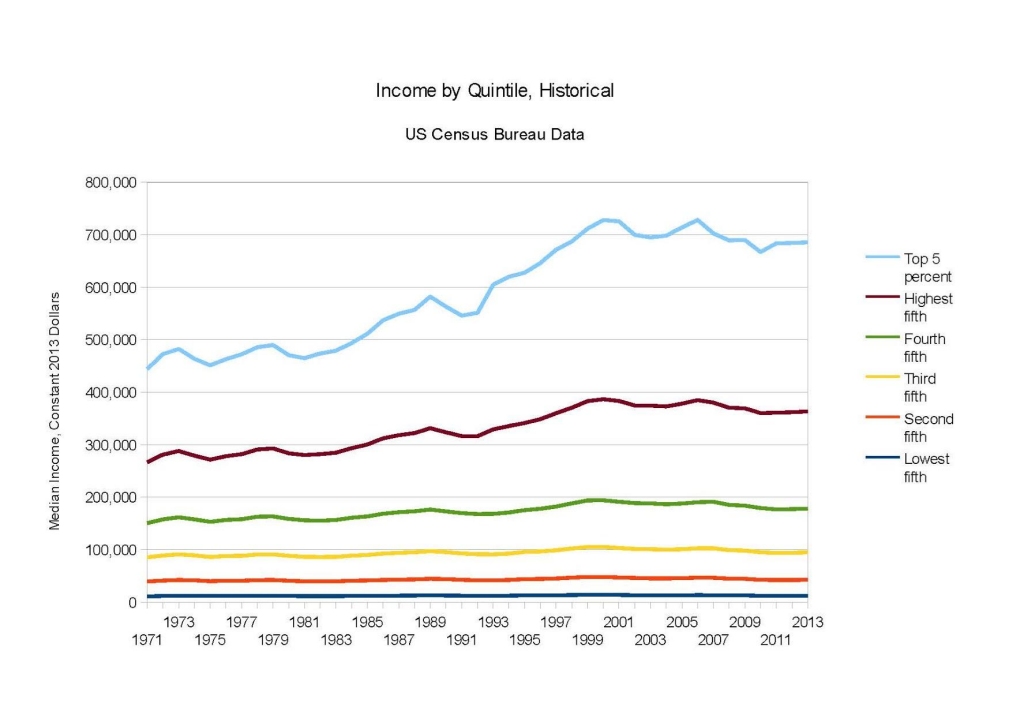
The result is as predictable as it is depressing. Real wages in America have been essentially flat for 40 years except for those at the top of the earnings heap.
Moreover, the flood of cheap – and increasingly well educated – labor into the market economy is changing the very nature of the jobs that remain. A good job once meant a stable career, good pay, and generous benefits. But now employers are cutting back. Once generous pay packages are being replaced with two-tier systems.
Several years ago the New York Times reported on the growth of two-tier pay systems in the automotive industry where new hires may earn half of what older workers make. Other companies turn to ‘contingent workers,’ that is to say, independent contractors, part-timers who earn low pay and few benefits, and short-term employees leased from temp services. In Japan, once renowned for lifetime employment, contingent workers now account for roughly one-third (2) of the workforce. A Wall Street Journal Blog a few months ago claimed a similar fraction in the US. The GAO, using a somewhat restrictive definition of contingency workers, put the fraction at 7.9%(3). The truth is likely between the two, perhaps 10-12%, and growing.
In any event, lower-paid workers and contingency workers still count as employed for purposes of Bureau of Labor Statistics measures. But lower pay and unstable employment do not stimulate the robust demand that will lift the economy out of the doldrums.
The world economy is drowning in a sea of supply generated by the huge influx of low-wage workers. These workers don’t earn enough to generate brisk, broad demand and first world workers with uncertain employment futures and diminishing income potential don’t generate brisk demand either. Meanwhile, a massive shift of wealth from labor to capital leaves the economy awash in cheap money as investment capital looks for returns. This will result in asset bubbles as surely as night follows day. Unfortunately, it is difficult to imagine a mechanism that will restore equilibrium in even the mid-term much less the near term.
Resources:
- http://www.federalreserve.gov/pubs/feds/2014/201404/201404pap.pdf
- http://www.rieti.go.jp/en/publications/summary/11030030.html
- http://www.gao.gov/products/GAO-15-168R
You might also like: