
January’s Unadjusted U-6 Unemployment Rate 8.7%
Current U-6 Unemployment Rate:
The official Unadjusted U-6 unemployment rate peaked at 22.4% in April 2020 due to COVID shutdowns. A year later, it was down to 9.9%. By April 2022, it was 6.6%, and in April 2023, it bottomed at 6.1%.
From there, it rose to 8.2% in July 2024 and in January 2025. It hovered between 7% and 8% throughout 2024 and peaked at 8.1% in August 2025 before falling the next month to 7.7%.
Prior to COVID, unadjusted U-6 unemployment was 6.5% from September through November 2019.
The COVID spike took it higher than it had ever been since it was created in 1994. The previous peak was 17.9% in February 2010.
What is U-6 Unemployment?
U-6 is a broader measure of unemployment, including discouraged workers, and many consider U-6 to be “the Real Unemployment Rate” See: What is U-6 Unemployment? for the full definition of U-6 Unemployment.
As you can see from the chart below, the unadjusted U-6 unemployment rate was 15.2% in December 2011 and 14.4% in December 2012. By July, it bounced up again to 15.2%, and in October, the U-6 miraculously fell back to 13.9% just in time for the election. But by January 2013, it was back to 15.4%. By January 2014, it was at 13.5%, and by October 2014, it was down to the 11% range. In January 2015, it bounced back up to 12% but promptly returned to 10.4% by April.
Comparing U3 to U6
If you look at the chart below carefully, you may notice that when unemployment rises, the gap between U-3 and U-6 increases. For instance, in October 2000, unemployment was at one of the lowest levels on this chart, with U-3 at 3.6% and U-6 at 6.3%. For a difference of only 2.7%. At the unemployment peak in January 2010, U-3 was 10.6%. But U-6 shot all the way up to 18% for a difference of 7.4%.
The following chart is a comparison of the Official Unemployment Rate U-3 to the broader U-6 Unemployment rate. We can see that U-6 is always higher than the often quoted U-3 “Unemployment Rate”.
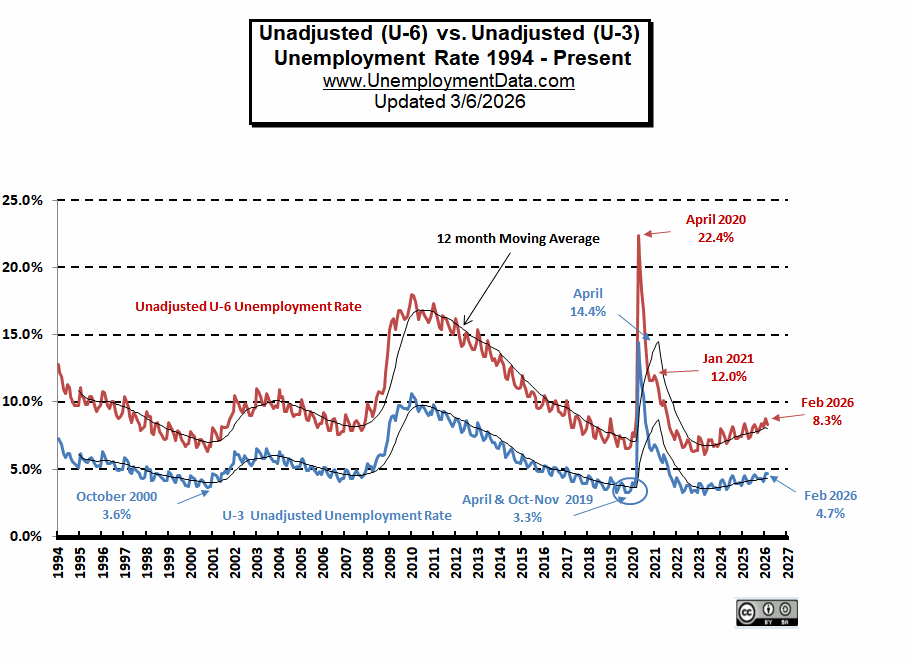 This is primarily because, as times get more difficult, people increasingly give up looking for jobs. When the good times are rolling, and jobs are plentiful, it is easy to get a job, so even the casual applicant will have a job. But this leads us back to the question… Why do we have a U-3 number at all? Aren’t all U-6 people unemployed? But during bad times like the “post-2008 years,” it is scary to hear the Unemployment rate is 18% (U-6) but less scary if the number you hear is “only” 10.6% (U-3), so the government prefers the U-3 number, and unfortunately, the news media plays along and uses the U-3 number because it is the “Official” unemployment rate.
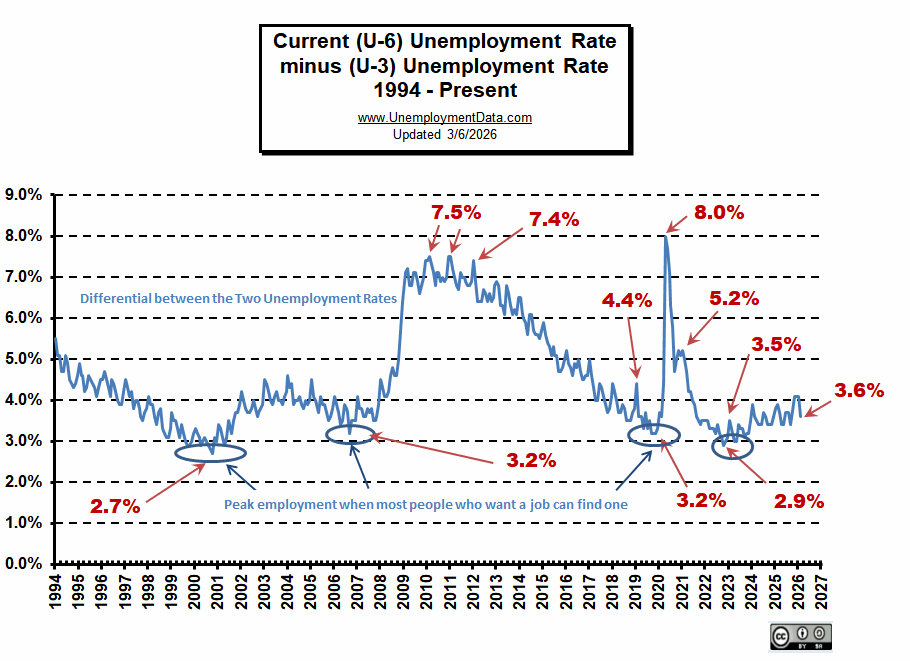
In the chart below, we have subtracted the U3 unemployment rate from the U6 unemployment rate, and so we see the differential. When the differential is low, it is easier to find a job (i.e. everyone who wants one can find one).
The Differential between U3 and U6 Unemployment
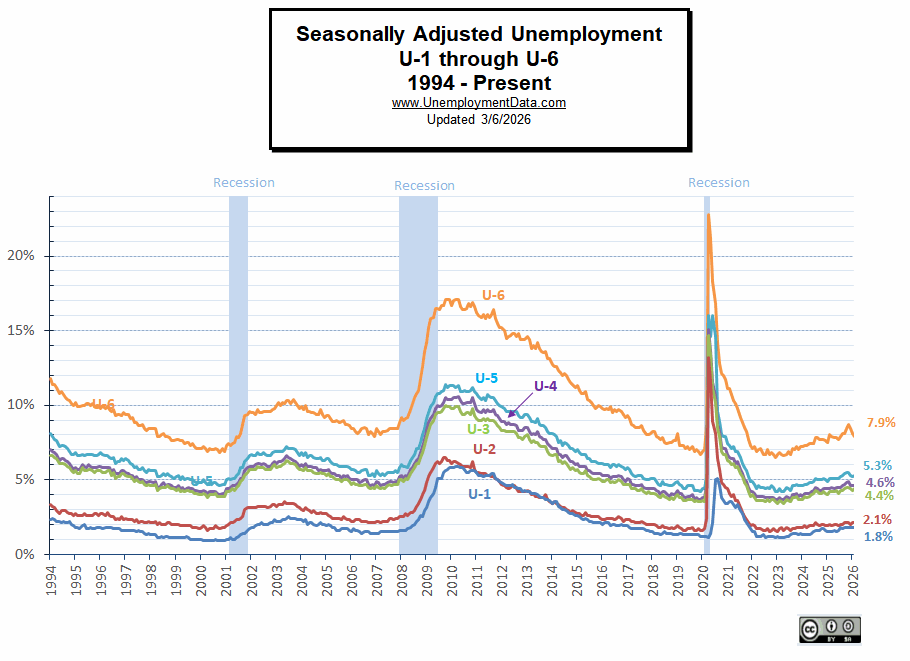
All Six Adjusted Unemployment Rates U1 through U6
More?
- How many jobs are there actually? This chart shows Employment since Jan 2000 and what the current trend is and might be more accurate than the unemployment numbers. Current Employment Data
- Historical Employment Data Chart– How Many People Are Actually Employed? This chart shows the actual employment rate without all the mumbo-jumbo. It gives a clear picture of the employment level in the United States from 1939 to the Present. When employment is rising, the economy is growing. When the employment rate levels off or declines, times are not so good. Take a look and see how employment rates correspond to recessions over time.
- What is “Full Employment”, and are we really getting close? Is the U.S. Really at “Full Employment”?
- Misery Index– Created by economist Arthur Okun to help gauge the level of misery the average person is suffering. It is a combination of the inflation rate and the unemployment rate.
Note: Effective July 2017, the independently produced Gallup equivalent called the “Underemployment Rate” ceased being published. However, Gallup was typically 4% to 4.5% higher than the BLS numbers.
See Also:
- What is the Labor Force Participation Rate? and how does it affect the unemployment rate?
- Job Growth Stalls, Labor Participation at 38-Year Low
- What is the True Unemployment Rate? – Is the Government Fudging the numbers?
- What is the Real Unemployment Rate? – Should discouraged workers be counted?
Source: U.S. Bureau of Labor Statistics- U-6 Unemployment Rate
Using the UE rates in 06-08 which basically reflected an artificial boom driven by overvalued housing and dodgy debt is still misleading. Are you suggesting that we need to go back to a time when the economy looked great but was a deck of cards?
What do you mean “go back”… the economy is still a house of cards or an inflated balloon looking for a pin. The FED simply papered over the problem by substituting Government debt for private debt. It didn’t allow market forces to punish the foolish and eliminate the debt, it simply shuffled the cards, thereby moving the dodgy part somewhere else. The systemic rot is still there. By postponing the inevitable it simply made the problem worse.
So what is the real rate; 10 or 15?
It is important to create an accurate stat.
That depends on who you trust more. The BLS who has political reasons for fudging the numbers or Gallup who has economic incentives to get the numbers right.
“By July [2012] it bounced up again to 15.2% and in October the U-6 miraculously fell back to 13.9% just in time for the election. But by January 2013 it was back to 15.4%.”
No miracle, just the normal seasonal variations. Seasonally adjusted numbers are published to allow month to month comparisons. It is only valid to compare unadjusted numbers to the same month in other years. The seasonally adjusted numbers are July – 14.8%, October – 14.4%, and January 14.5%.
Except the seasonal variation doesn’t normally start until the November hiring for Black Friday not in September or October. If you look at the numbers closely like we do, compared to previous years they look fishy.
Thanks for continuing to watch these numbers and break them down. From adjusted historical data to large shifts around election time, it is difficult to not view official numbers without a skeptical eye. I wish that were not the case.
Unemployment numbers are useful but incomplete. Income and especially disposable income are also important. BLS has a useful monograph that includes a chart plotting productivity and real compensation (http://www.bls.gov/opub/mlr/2011/01/art3full.pdf). Real compensation began lagging productivity increases in the early 70s and the differential has grown steadily.
This is important because this recession is marked by a breathtaking disconnect between burgeoning global supply and tepid domestic demand (people with no jobs or low paying jobs cannot afford to consume at the same level as fully employed people). Credit discounted far below its natural level has propped up demand somewhat but that party has to come to an end. What happens as credit pricing returns to historically normal levels?
We have been borrowing against the future rather than addressing the structural problems created by moving millions of domestic jobs to low cost foreign venues. Those domestic workers don’t simply disappear, only their jobs disappear.
You are right! The U-6 rate should be the true unemployment rate, not U-3!