
May’s Unadjusted U-3 was 4.1%
May’s Seasonally Adjusted U-3 was 4.3%
How Does the Unadjusted Unemployment Rate Compare to the Seasonally Adjusted Unemployment Rate?
Updated June 5, 2026
What is the difference between the unadjusted and seasonally adjusted unemployment rate?
 Personally, I prefer my numbers straight. I don’t like the fact that someone in the government has “adjusted” them.
But according to the BLS:
Seasonal adjustment is a statistical technique that eliminates the influences of weather, holidays, the opening and closing of schools, and other recurring seasonal events from economic time series. This permits easier observation and analysis of cyclical, trend, and other nonseasonal movements in the data. By eliminating seasonal fluctuations, the series becomes smoother, and it is easier to compare data from month to month.In theory, removing these fluctuations makes the data easier to compare from month to month. And in practice, it looks somewhat like a moving average, smoothing out the peaks and valleys. Let’s look at how seasonally adjusted data compares to unadjusted unemployment data on a chart.
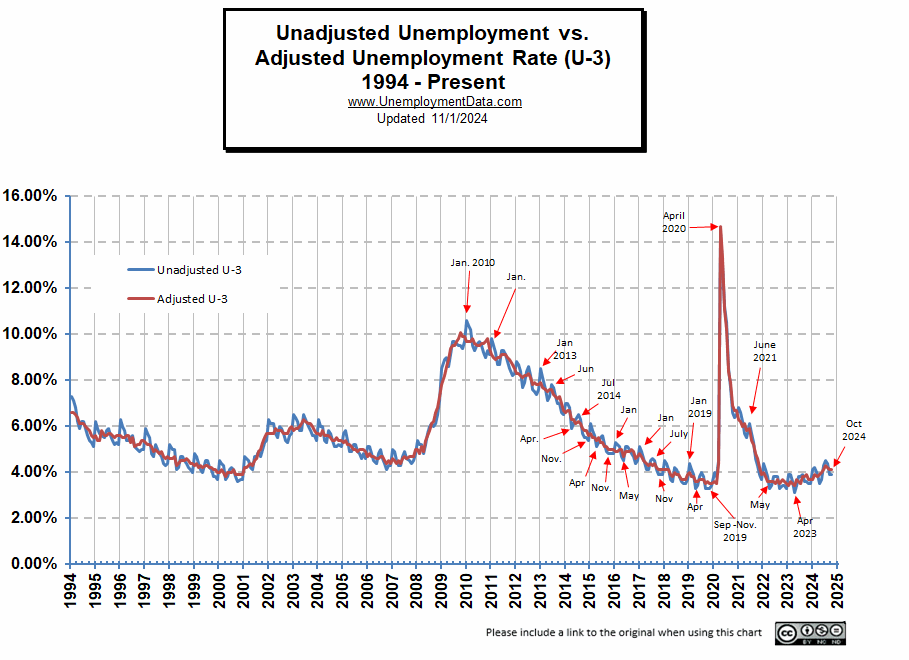
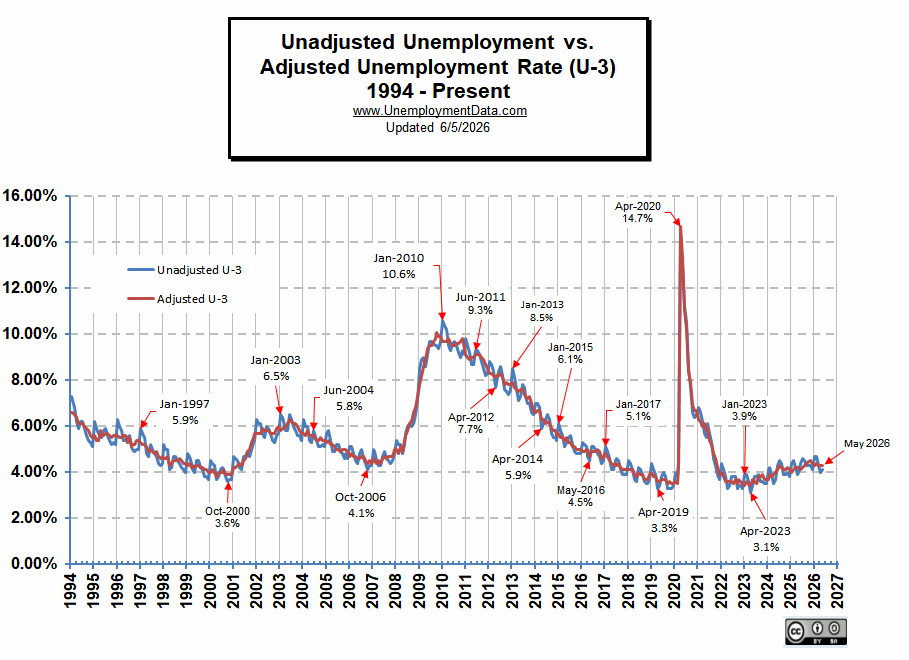
As we can see from the chart below, the seasonally adjusted numbers are smoother. Thus, seeing the big trend is easier by eliminating a lot of the month-to-month “noise,” i.e., where the original data bounced up and down around the adjusted numbers quite a bit. Because of the bouncing around, the adjusted numbers could often move in one direction while the unadjusted numbers move in the opposite direction.
For instance, in the period from 2010 through 2020, the seasonally adjusted unemployment rate generally moved down. Half the time, the unadjusted numbers were moving up… although the overall trend was still down.
Unadjusted Unemployment vs. Seasonally Adjusted Unemployment Rate Chart
Seasonal Adjustment of the Unemployment Rate
Looking at the chart snippet below of the Unadjusted vs. Seasonally Adjusted Unemployment Rate:
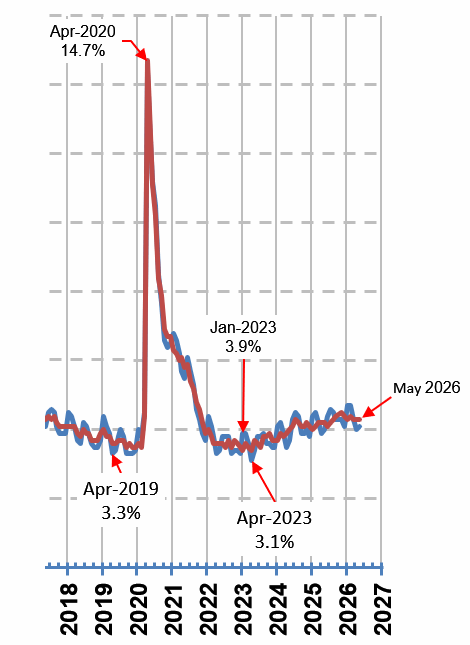 Often in November, the unadjusted unemployment rate (blue line) is below the adjusted unemployment rate. But then, by January, unemployment jumps up above the seasonally adjusted rate. If we think about it, it makes sense because extra workers are hired in November to get ready for the Christmas rush. Thus, unemployment usually goes down for November and December. (Note: this didn’t happen in 2024 instead, unemployment went up slightly) . And then they are laid-off in January, so the unadjusted unemployment rate goes up again. By adjusting for these normal seasonal fluctuations, we can see if something else is affecting unemployment.
So, knowing that this happens every year, the adjusted rate takes that into consideration and gives you a line somewhere in the middle. Interestingly, the same thing tends to happen again somewhere around June as well. However, in March/April of 2020, we got a strange anomaly due to massive layoffs due to the Coronavirus shutdown. They both shot up so quickly that the blue line is totally hidden behind the red line.
How Does U-3 Compare to U-6?
The U-3 Unemployment rate takes a relatively narrow view of who qualifies as “Unemployed” and excludes people who are considered “discouraged workers” who have given up looking for work. Discouraged workers ARE included in the U-6 unemployment rate. To see a comparison chart of the U-6 unemployment rate compared to the U-3 rate. See U-3 vs. U-6 Unemployment Comparison.
See Also:
Short but very accurate information… Many thanks for sharing this one.
A must read post!
Great post! Keep it up.
This is the right blog for anybody who hopes to find out about “Seasonally Adjusted Unemployment”. You know so much its almost hard to argue with you (not that I really would want to… HaHa). You certainly put a brand new spin on this topic. Excellent stuff, just wonderful!
Hi, I’m doing a report on unemployment. Im trying to understand the seasonal adjusted versus the non-seasonal adjusted easier. Is seasonal all year round to which its more secure in some aspect to have a job versus non-seasonal in which your concerned that you may become unemployed.
I thank you and I look forward for a response back……
Patricia,
Good question! Although “Seasonal Work” means you might work during the fall picking apples that isn’t what they mean by seasonally adjusted. The difference between Seasonally Adjusted and Non-Adjusted numbers is all statistical. For instance typically a lot of people are hired in November just to get ready for the Christmas rush and they are let go in January once all the extra work is over.
If the work force increases by an average of 5% in November and decreases by the same amount in January, the Bureau of Labor Statistics takes that into account in the “adjusted” numbers.
So if this year employment increased by 6% in November instead of just 5%, the BLS would show the adjusted numbers as up 1%. But if it was only up 4% the BLS would show the adjusted numbers as down 1% even though the non-adjusted numbers would actually be up by 6% and 4% respectively. Hope this helps!