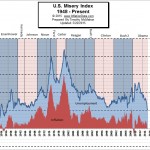
 The misery index was created by economist Arthur Okun during the 1960s at a time when the index was actually at historically good levels. The misery index is a combination of two simple factors (i.e. inflation and unemployment) that makes life difficult for the average citizen. The higher the index, the more misery. High levels of price inflation (rapidly rising prices) will cause households to have difficulty affording the basic necessities, while high unemployment will leave a high percentage of households without any income at all. High combined levels will cause havoc throughout the economy and a high level of distress, discomfort, and political unrest.
InflationData has published an interesting chart of the Misery Index, which includes the inflation rate, the unemployment rate, the misery index and the political party responsible. This chart is very informative in that you can see a lot of information in a very succinct way. See: InflationData’s Misery Index.
