
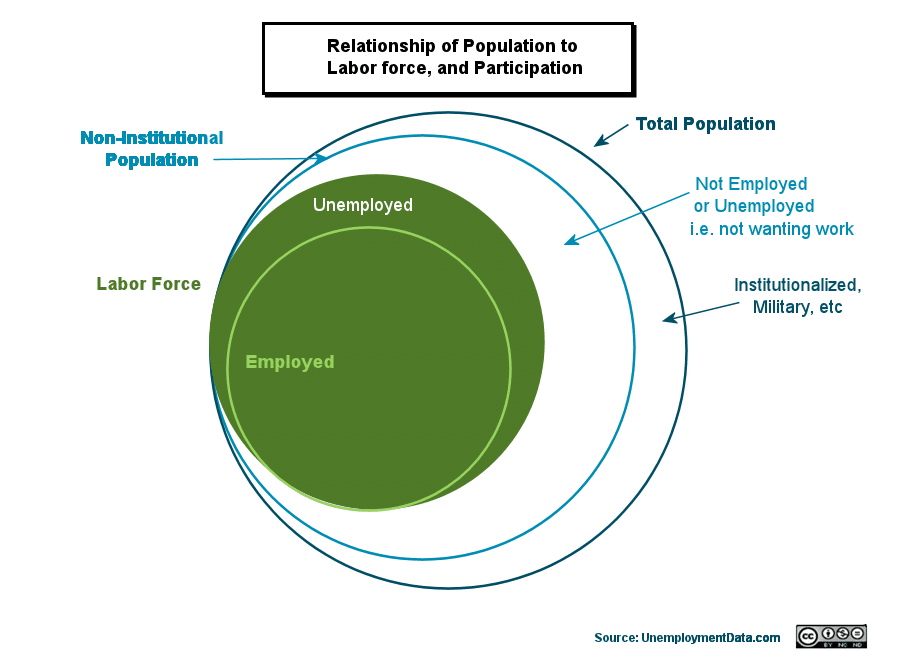
While the Labor Force Participation Rate (LFPR) shows the percentage of the population in the Labor Force (i.e., working or looking for work), the less commonly known, Employment-Population ratio more accurately represents what most people think the LFPR should represent (i.e., the percentage of the total population that is actually working).
The LFPR is based on “desire” (i.e., the government tries to discern whether people are interested in working and are thus in the workforce). But determining this is subject to much interpretation and thus opens the possibility of fudging the numbers. But the Employment-Population ratio only looks at those who are actually working (not just “looking for work” or pretending to look for work) and compares that to the total population, so the numbers are much more concrete and less subject to interpretation. So the Employment – Population Ratio is the percentage of the largest circle to the smallest circle in this diagram. While the LFPR is the relationship of the 2nd largest circle to the 3rd largest circle.
Employment-Population Ratio Definition and Formula
According to the U.S. Bureau of Labor Statistics– “The employment-population ratio represents the number of employed people as a percentage of the civilian noninstitutional population. In other words, it is the percentage of the population that is currently working.”
The employment-population ratio is calculated as: (Employed ÷ Civilian Noninstitutional Population) x 100%.
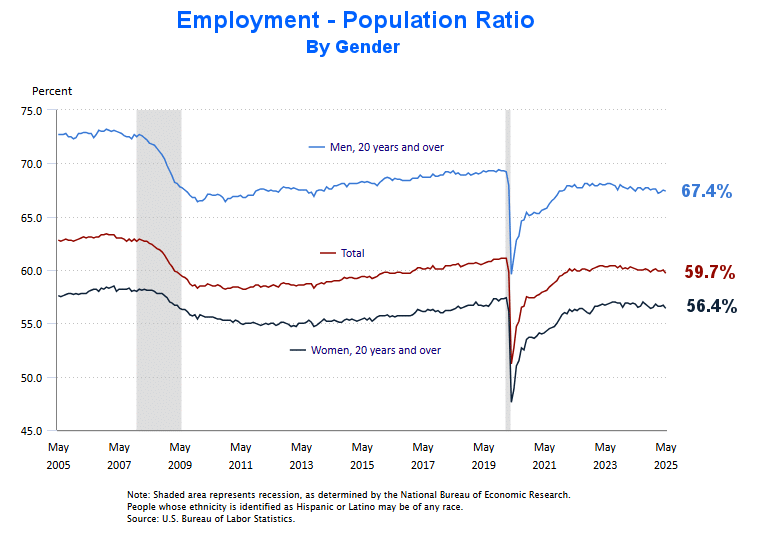
The following chart shows the employment-population ratio for the entire population and for just men and just women. As you can see, back in 2005 about 72% of men were working and 57.5% of women were working. In 2008 the Great Recession caused a massive decline in employment for both men and women. In December of 2009, only 66.4% of men were working, and 55.4% of women. And now, over a decade and a half later, women workers rebounded to 56.7%, but men only rebounded to 67.5%.
Employment-Population Ratio by Gender (Seasonally Adjusted)
This month, we saw a slight dip in all three categories. Employed men fell from 67.5% to 67.4%. Employed women fell from 56.7% to 56.4% and the Total Population fell from 60.0% to only 59.7% of the total population being employed.
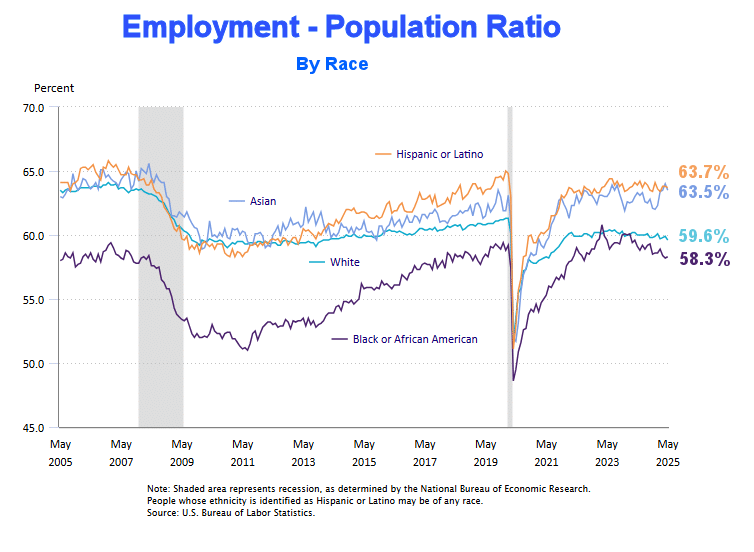
Employment-Population Ratio by Race
Hispanics and Asians are the most employed by percentage of their population, in April Asians slightly outpaced Hispanics as the highest percentage employed, but in May Hispanics reclaimed the top spot. Whites came in third, followed by African Americans.
Employment-Population Analysis
Employment-Population Ratio Annual Averages
From 1948 through 1976, between 55% and 58.2% of the total population worked outside the home. But in 1977, all that began to change. By the end of 1977, it was at 58.7%, and by 1979 it was over 60%.
Those numbers continued to climb for the next two decades, and at the turn of the century, the Employment-Population ratio was around 65%. For the next decade, it fell rather steadily (with a brief respite from 2004-2007). So, by 2010, it was back to around 58.5%.
Through the teens, it gradually regained a bit of its loss. And, by the end of 2019 and the beginning of 2020, the Employment-Population ratio was hovering between 61.0% and 61.2%. At that point, roughly 61% of the population was working… 4% less than in 2000. But then, due to the COVID-19 virus, we saw a sharp drop in March 2020 to 60.0%, and April saw an unprecedented drop to 51.3%.
Source: BLS Seasonally Adjusted Employment-Population Ratio
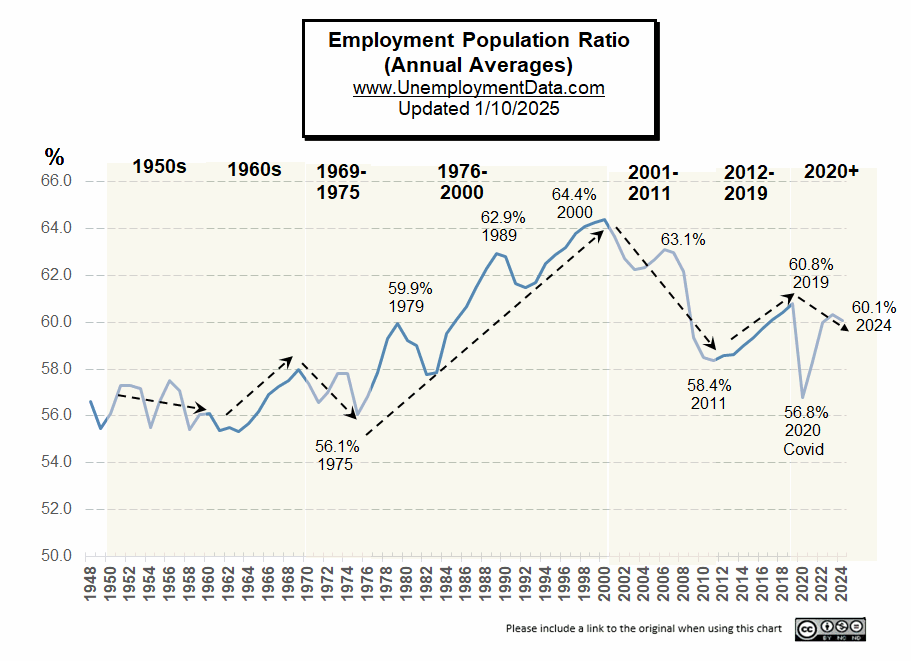
If we look only at the annual averages, the longer-term chart (above) from 1948 through 2021 gives us a good picture of the long-term trends. We can see that after WWII, the 1950s saw a gradual decrease (with sharp ups and downs) in the employment-population ratio as wives stopped working and started raising families.
The 1960s saw women returning to the workforce as “Women’s Liberation” took hold and women sought careers. Interestingly, from 1969-1975 once again, the percentage of the population in the workforce fell, and it wasn’t until the late 1970s that the employment-population ratio approached 60% for the first time. Then from 1976 through 2000, the percentage of the population zoomed from 56% to over 64% (with a couple of brief retracements). The early 2000s saw a drastic drop back to 58.4%, but from 2011 through 2019 the percentage of the population in the workforce rose again to 60.8% before falling due to Covid shutdowns.
The economy is generally more stable and balanced when it has a larger percentage of the population working rather than placing the entire load on a smaller portion of the people. Thus even though a significant portion of the workforce lost their jobs in 2008-2010, many families had one of their members still working, going from a two-income family to a single income. Similarly, during the Covid shutdown, the same thing happened, and a portion of those families decided that they liked it that way and didn’t return to work. This is one reason the employment-population ratio has not returned to previous highs despite companies actively recruiting new employees.
Recent Developments in the Employment-Population Ratio
By July 2020, the Employment-Population ratio had regained roughly half of its loss, taking it back to 55.1%. Then the Employment / Population ratio rose steadily throughout 2021, so by May 2021, it was 58.0%. It increased slowly until December when it reached 59.5%. Through May 2022, the employment-population ratio only increased another 0.6% to reach 60.1%, where it began to falter, and by October, it was still at 60.0%. In May and June 2023, it was 60.3%, down slightly from April’s 60.4%. But in July it returned to 60.4% where it remained through September 2023.
According to the BLS Commissioner’s Report in January 2024:
“…The labor force participation rate, at 62.5 percent, was unchanged in January, and the employment-population ratio, at 60.2 percent, was little changed.”
Interestingly, until September 2022, the “pandemic” was still an excuse for many people. According to the BLS Household Survey Supplemental Data:
June 2022: “Among those not in the labor force in June [2022], 610,000 persons were prevented from looking for work due to the pandemic …
July 2022: “Among those not in the labor force in July, 548,000 people were prevented from looking for work due to the pandemic.”
August 2022: “Among those not in the labor force in August, 523,000 people were prevented from looking for work due to the pandemic…”
September 2022: “In September, 1.4 million persons reported they had been unable to work because their employer closed or lost business due to the pandemic–that is, they did not work at all or worked fewer hours at some point in the 4 weeks preceding the survey due to the pandemic. This measure is down from 1.9 million in the previous month and from 49.8 million in May 2020. Among those who reported in September that they were unable to work because of pandemic-related closures or lost business, 21.4 percent received at least some pay from their employer for the hours not worked, essentially the same as in August. Among those not in the labor force in September, 452,000 persons were prevented from looking for work due to the pandemic, little changed from the prior month. In May 2020, 9.7 million persons were prevented from looking for work due to the pandemic. (To be counted as unemployed, by definition, individuals must be either actively looking for work or on temporary layoff.)”
October 2022: The BLS Commissioner finally stops mentioning the pandemic as an excuse for not working.
Employment / Population Ratio Table (in Percent)
| Year | Jan | Feb | Mar | Apr | May | Jun | Jul | Aug | Sep | Oct | Nov | Dec | Annual Average |
| 2025 | 60.1 | 59.9 | 59.9 | 60.0 | |||||||||
| 2024 | 60.2 | 60.1 | 60.3 | 60.2 | 60.1 | 60.1 | 60.0 | 60.0 | 60.2 | 60.0 | 59.8 | 60.0 | 60.1 |
| 2023 | 60.2 | 60.2 | 60.4 | 60.4 | 60.3 | 60.3 | 60.4 | 60.4 | 60.4 | 60.2 | 60.4 | 60.1 | 60.3 |
| 2022 | 59.7 | 59.9 | 60.1 | 60.0 | 60.1 | 59.9 | 60.0 | 60.1 | 60.1 | 60.0 | 59.9 | 60.1 | 60.0 |
| 2021 | 57.5 | 57.6 | 57.8 | 57.9 | 58.0 | 58.0 | 58.4 | 58.5 | 58.8 | 58.9 | 59.3 | 59.5 | 58.2 |
| 2020 | 61.1 | 61.1 | 59.9 | 51.3 | 52.8 | 54.6 | 55.2 | 56.5 | 56.6 | 57.4 | 57.4 | 57.4 | 56.8 |
| 2019 | 60.7 | 60.7 | 60.7 | 60.6 | 60.6 | 60.7 | 60.8 | 60.8 | 60.9 | 60.9 | 61.0 | 61.0 | 60.8 |
| 2018 | 60.2 | 60.4 | 60.4 | 60.4 | 60.5 | 60.5 | 60.6 | 60.3 | 60.4 | 60.5 | 60.5 | 60.5 | 60.4 |
| 2017 | 59.9 | 59.9 | 60.2 | 60.2 | 60.1 | 60.1 | 60.2 | 60.1 | 60.4 | 60.1 | 60.1 | 60.1 | 60.1 |
| 2016 | 59.7 | 59.8 | 59.8 | 59.7 | 59.7 | 59.7 | 59.8 | 59.8 | 59.7 | 59.7 | 59.7 | 59.7 | 59.7 |
| 2015 | 59.3 | 59.2 | 59.2 | 59.3 | 59.4 | 59.4 | 59.3 | 59.4 | 59.2 | 59.3 | 59.4 | 59.6 | 59.3 |
| 2014 | 58.8 | 58.7 | 58.9 | 58.9 | 58.9 | 59.0 | 59.0 | 59.0 | 59.1 | 59.3 | 59.2 | 59.3 | 59.0 |
| 2013 | 58.6 | 58.6 | 58.5 | 58.6 | 58.6 | 58.6 | 58.7 | 58.7 | 58.7 | 58.3 | 58.6 | 58.7 | 58.6 |
| 2012 | 58.4 | 58.5 | 58.5 | 58.4 | 58.5 | 58.6 | 58.5 | 58.4 | 58.7 | 58.8 | 58.7 | 58.7 | 58.6 |
| 2011 | 58.3 | 58.4 | 58.4 | 58.4 | 58.3 | 58.2 | 58.2 | 58.3 | 58.4 | 58.4 | 58.6 | 58.6 | 58.4 |
| 2010 | 58.5 | 58.5 | 58.5 | 58.7 | 58.6 | 58.5 | 58.5 | 58.6 | 58.5 | 58.3 | 58.2 | 58.3 | 58.5 |
| 2009 | 60.6 | 60.3 | 59.9 | 59.8 | 59.6 | 59.4 | 59.3 | 59.1 | 58.7 | 58.5 | 58.6 | 58.3 | 59.3 |
| 2008 | 62.9 | 62.8 | 62.7 | 62.7 | 62.5 | 62.4 | 62.2 | 62.0 | 61.9 | 61.7 | 61.4 | 61.0 | 62.2 |
| 2007 | 63.3 | 63.3 | 63.3 | 63.0 | 63.0 | 63.0 | 62.9 | 62.7 | 62.9 | 62.7 | 62.9 | 62.7 | 63.0 |
| 2006 | 62.9 | 63.0 | 63.1 | 63.0 | 63.1 | 63.1 | 63.0 | 63.1 | 63.1 | 63.3 | 63.3 | 63.4 | 63.1 |
| 2005 | 62.4 | 62.4 | 62.4 | 62.7 | 62.8 | 62.7 | 62.8 | 62.9 | 62.8 | 62.8 | 62.7 | 62.8 | 62.7 |
| 2004 | 62.3 | 62.3 | 62.2 | 62.3 | 62.3 | 62.4 | 62.5 | 62.4 | 62.3 | 62.3 | 62.5 | 62.4 | 62.4 |
| 2003 | 62.5 | 62.5 | 62.4 | 62.4 | 62.3 | 62.3 | 62.1 | 62.1 | 62.0 | 62.1 | 62.3 | 62.2 | 62.3 |
| 2002 | 62.7 | 63.0 | 62.8 | 62.7 | 62.9 | 62.7 | 62.7 | 62.7 | 63.0 | 62.7 | 62.5 | 62.4 | 62.7 |
| 2001 | 64.4 | 64.3 | 64.3 | 64.0 | 63.8 | 63.7 | 63.7 | 63.2 | 63.5 | 63.2 | 63.0 | 62.9 | 63.7 |
| 2000 | 64.6 | 64.6 | 64.6 | 64.7 | 64.4 | 64.5 | 64.2 | 64.2 | 64.2 | 64.2 | 64.3 | 64.4 | 64.4 |
| 1999 | 64.4 | 64.2 | 64.2 | 64.2 | 64.3 | 64.2 | 64.2 | 64.2 | 64.2 | 64.3 | 64.4 | 64.4 | 64.3 |
| 1998 | 64.0 | 64.0 | 64.0 | 64.1 | 64.1 | 64.0 | 64.0 | 63.9 | 64.2 | 64.1 | 64.2 | 64.3 | 64.1 |
| 1997 | 63.4 | 63.4 | 63.6 | 63.7 | 63.8 | 63.7 | 63.9 | 63.9 | 63.9 | 63.9 | 64.1 | 64.0 | 63.8 |
| 1996 | 62.7 | 62.9 | 63.0 | 63.0 | 63.0 | 63.2 | 63.3 | 63.3 | 63.4 | 63.5 | 63.4 | 63.4 | 63.2 |
| 1995 | 63.0 | 63.1 | 63.1 | 63.1 | 62.7 | 62.7 | 62.8 | 62.8 | 62.9 | 62.9 | 62.8 | 62.7 | 62.9 |
| 1994 | 62.2 | 62.3 | 62.1 | 62.3 | 62.5 | 62.3 | 62.3 | 62.6 | 62.7 | 62.9 | 63.0 | 63.1 | 62.5 |
| 1993 | 61.4 | 61.4 | 61.5 | 61.5 | 61.7 | 61.8 | 61.8 | 62.0 | 61.7 | 61.8 | 61.9 | 62.0 | 61.7 |
| 1992 | 61.5 | 61.3 | 61.5 | 61.6 | 61.5 | 61.5 | 61.6 | 61.6 | 61.4 | 61.3 | 61.4 | 61.4 | 61.5 |
| 1991 | 62.0 | 61.9 | 61.8 | 62.0 | 61.6 | 61.7 | 61.6 | 61.5 | 61.6 | 61.5 | 61.4 | 61.2 | 61.7 |
| 1990 | 63.2 | 63.2 | 63.2 | 63.0 | 63.1 | 62.9 | 62.8 | 62.7 | 62.5 | 62.5 | 62.3 | 62.2 | 62.8 |
| 1989 | 62.9 | 62.9 | 62.9 | 62.9 | 62.9 | 63.0 | 63.0 | 63.1 | 62.8 | 62.9 | 63.0 | 63.0 | 62.9 |
| 1988 | 62.0 | 62.1 | 61.9 | 62.2 | 62.0 | 62.3 | 62.3 | 62.4 | 62.4 | 62.5 | 62.7 | 62.6 | 62.3 |
| 1987 | 61.0 | 61.1 | 61.2 | 61.3 | 61.6 | 61.4 | 61.6 | 61.8 | 61.6 | 61.8 | 61.9 | 62.0 | 61.5 |
| 1986 | 60.6 | 60.3 | 60.5 | 60.5 | 60.5 | 60.7 | 60.8 | 60.8 | 60.8 | 60.9 | 60.9 | 61.0 | 60.7 |
| 1985 | 59.9 | 60.0 | 60.2 | 60.1 | 60.1 | 59.8 | 59.9 | 60.0 | 60.3 | 60.3 | 60.4 | 60.4 | 60.1 |
| 1984 | 58.8 | 59.1 | 59.1 | 59.3 | 59.7 | 59.9 | 59.8 | 59.6 | 59.7 | 59.7 | 59.8 | 59.9 | 59.5 |
| 1983 | 57.2 | 57.1 | 57.1 | 57.3 | 57.3 | 57.8 | 58.1 | 58.2 | 58.4 | 58.4 | 58.7 | 58.8 | 57.9 |
| 1982 | 58.2 | 58.2 | 58.1 | 57.9 | 58.2 | 57.8 | 57.7 | 57.8 | 57.6 | 57.4 | 57.3 | 57.2 | 57.8 |
| 1981 | 59.1 | 59.2 | 59.4 | 59.6 | 59.5 | 59.0 | 59.1 | 59.1 | 58.7 | 58.8 | 58.6 | 58.2 | 59.0 |
| 1980 | 60.0 | 60.0 | 59.7 | 59.4 | 59.1 | 58.9 | 58.8 | 58.8 | 58.9 | 58.9 | 59.0 | 59.0 | 59.2 |
| 1979 | 59.9 | 60.1 | 60.0 | 59.8 | 59.8 | 59.9 | 60.0 | 59.8 | 60.0 | 59.9 | 60.0 | 60.1 | 59.9 |
| 1978 | 58.8 | 58.8 | 58.8 | 59.2 | 59.3 | 59.5 | 59.3 | 59.4 | 59.5 | 59.7 | 59.8 | 59.8 | 59.3 |
| 1977 | 57.0 | 57.2 | 57.4 | 57.6 | 57.8 | 57.9 | 57.8 | 58.0 | 58.1 | 58.2 | 58.6 | 58.7 | 57.9 |
| 1976 | 56.4 | 56.5 | 56.7 | 56.8 | 57.0 | 56.8 | 57.0 | 57.0 | 56.9 | 56.9 | 57.0 | 57.0 | 56.8 |
| 1975 | 56.4 | 56.1 | 56.0 | 55.9 | 56.0 | 55.8 | 56.0 | 56.1 | 56.1 | 56.1 | 56.0 | 56.1 | 56.1 |
| 1974 | 58.2 | 58.2 | 58.2 | 58.0 | 58.0 | 58.0 | 58.0 | 57.8 | 57.7 | 57.6 | 57.3 | 56.9 | 57.8 |
| 1973 | 57.1 | 57.5 | 57.8 | 57.7 | 57.7 | 58.0 | 57.9 | 57.8 | 57.9 | 58.1 | 58.2 | 58.2 | 57.8 |
| 1972 | 56.7 | 56.7 | 56.9 | 56.9 | 57.0 | 57.0 | 57.0 | 57.1 | 57.0 | 57.0 | 57.2 | 57.3 | 57.0 |
| 1971 | 56.8 | 56.6 | 56.4 | 56.6 | 56.6 | 56.2 | 56.5 | 56.6 | 56.6 | 56.6 | 56.8 | 56.8 | 56.6 |
| 1970 | 58.0 | 57.9 | 57.9 | 57.9 | 57.5 | 57.3 | 57.4 | 57.2 | 57.0 | 57.0 | 56.9 | 56.7 | 57.4 |
| 1969 | 57.6 | 57.9 | 57.9 | 57.9 | 57.8 | 58.0 | 58.0 | 58.1 | 58.1 | 58.1 | 58.1 | 58.1 | 58.0 |
| 1968 | 57.0 | 57.3 | 57.4 | 57.4 | 57.8 | 57.8 | 57.6 | 57.5 | 57.5 | 57.5 | 57.6 | 57.7 | 57.5 |
| 1967 | 57.1 | 57.0 | 56.8 | 57.1 | 57.0 | 57.3 | 57.4 | 57.4 | 57.4 | 57.5 | 57.5 | 57.6 | 57.3 |
| 1966 | 56.7 | 56.6 | 56.6 | 56.8 | 56.7 | 56.9 | 56.9 | 57.0 | 57.1 | 57.1 | 57.4 | 57.3 | 56.9 |
| 1965 | 55.7 | 55.7 | 55.9 | 56.0 | 56.2 | 56.1 | 56.5 | 56.3 | 56.2 | 56.4 | 56.4 | 56.6 | 56.2 |
| 1964 | 55.3 | 55.6 | 55.5 | 55.9 | 56.1 | 55.6 | 55.7 | 55.7 | 55.7 | 55.6 | 55.7 | 55.6 | 55.7 |
| 1963 | 55.2 | 55.1 | 55.3 | 55.5 | 55.3 | 55.3 | 55.4 | 55.4 | 55.5 | 55.5 | 55.4 | 55.3 | 55.4 |
| 1962 | 55.4 | 55.7 | 55.7 | 55.4 | 55.7 | 55.6 | 55.3 | 55.7 | 55.7 | 55.5 | 55.2 | 55.2 | 55.5 |
| 1961 | 55.7 | 55.5 | 55.6 | 55.2 | 55.2 | 55.6 | 55.2 | 55.3 | 55.0 | 55.3 | 55.5 | 55.3 | 55.4 |
| 1960 | 56.0 | 56.2 | 55.4 | 56.4 | 56.4 | 56.5 | 56.2 | 56.1 | 56.4 | 55.8 | 56.1 | 55.7 | 56.1 |
| 1959 | 55.7 | 55.5 | 56.0 | 56.3 | 56.2 | 56.3 | 56.3 | 56.1 | 56.0 | 56.1 | 55.7 | 56.3 | 56.0 |
| 1958 | 55.9 | 55.5 | 55.3 | 55.2 | 55.4 | 55.2 | 55.2 | 55.4 | 55.4 | 55.6 | 55.5 | 55.5 | 55.4 |
| 1957 | 57.0 | 57.5 | 57.6 | 57.2 | 57.1 | 57.2 | 57.5 | 56.9 | 57.0 | 56.8 | 56.4 | 56.6 | 57.1 |
| 1956 | 57.8 | 57.5 | 57.3 | 57.5 | 57.6 | 57.5 | 57.5 | 57.6 | 57.6 | 57.5 | 57.3 | 57.3 | 57.5 |
| 1955 | 55.7 | 55.7 | 55.8 | 56.2 | 56.3 | 56.3 | 56.9 | 57.1 | 57.2 | 57.2 | 57.4 | 57.7 | 56.6 |
| 1954 | 55.7 | 56.2 | 55.7 | 55.7 | 55.4 | 55.2 | 55.0 | 55.2 | 55.5 | 55.5 | 55.5 | 55.2 | 55.5 |
| 1953 | 57.8 | 58.0 | 58.1 | 57.5 | 57.1 | 57.4 | 57.4 | 57.1 | 56.8 | 56.7 | 56.5 | 55.7 | 57.2 |
| 1952 | 57.7 | 57.7 | 57.1 | 57.1 | 57.3 | 57.3 | 57.0 | 56.8 | 57.4 | 56.9 | 57.5 | 57.6 | 57.3 |
| 1951 | 56.9 | 57.0 | 57.7 | 57.3 | 57.6 | 57.1 | 57.6 | 57.4 | 57.1 | 57.3 | 57.1 | 57.7 | 57.3 |
| 1950 | 55.1 | 55.1 | 55.1 | 55.8 | 55.8 | 56.2 | 56.1 | 56.8 | 56.6 | 56.9 | 56.9 | 56.7 | 56.1 |
| 1949 | 56.2 | 56.2 | 56.0 | 55.7 | 55.4 | 55.0 | 55.0 | 55.1 | 55.3 | 54.9 | 55.6 | 55.3 | 55.5 |
| 1948 | 56.6 | 56.7 | 56.1 | 56.7 | 56.2 | 57.0 | 57.1 | 56.6 | 56.6 | 56.5 | 56.5 | 56.8 | 56.6 |