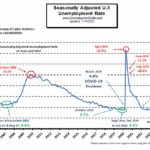
Today’s Headline

Is the Government Fudging Unemployment Numbers?
What is the True Unemployment Rate? There has been a lot of talk about the validity of the government generated unemployment numbers created by the U.S. … [Read More...]
Latest Unemployment News
Unemployment and Employment Charts
April 5, 2013 By Tim McMahon Leave a Comment
Unemployment Rate Chart - The seasonally adjusted unemployment rate from 1948 to the present is one of the most watched statistics. Where is it now and should you trust it? Current U-6 Unemployment Rate- … [Read More...]

BLS Changes Employment Numbers
April 5, 2013 By Tim McMahon 4 Comments
For a few months now I've been ranting about how there is no way that the Unemployment numbers are right because they don't match up with the employment numbers. A while back, I got an angry email from a … [Read More...]

Florida’s FLUID Unemployment Program
March 12, 2013 By Tim McMahon Leave a Comment
What is Fluid Unemployment? Fluid unemployment has nothing to do with changing jobs frequently or the changing rate of unemployment. FLUID stands for the FLorida Unemployment Internet Direct Claims … [Read More...]

Make a Difference: 3 Most Rewarding Careers
A rewarding career allows a person to enjoy both professional and personal benefits. The following outlines three rewarding careers that allow a person to be of service to others while making a real difference in their lives. A Special Education Teacher The work of a special education teacher is rewarding because this type of teacher [...]
Featured Articles
Unemployment and Employment Charts
April 5, 2013 By Tim McMahon Leave a Comment
Unemployment and Employment Charts
April 5, 2013 By Tim McMahon Leave a Comment
- Unemployment Rate Chart – The seasonally adjusted unemployment rate from 1948 to the present is one of the most watched statistics. Where is it now and should you trust it?
- Current U-6 Unemployment Rate- Many people consider the U-6 the “real” unemployment rate. See where it is now.
- Current Employment Data - How many jobs are there actually? This chart shows Employment since Jan 2000 and what the current trend is.
- Historical Employment Data Chart- How Many People Are Actually Employed? This chart shows the actual employment rate without all the mumbo-jumbo. It gives a clear picture of the employment level in the United States from 1939 to the Present. When employment is rising the economy is growing. When the employment rate levels off or declines times are not so good. Take a look and see how employment rates correspond to recessions over time.
- Current Employment vs Unemployment Chart When looking at employment vs. unemployment you would think that they are two sides of the same coin but the U.S. Bureau of Labor Statistics (BLS) actually uses two entirely different surveys to calculate them. Looking at both on the same chart we can see some strange anomalies.
- Misery Index- Created by economist Arthur Okun to help gauge the level of misery the average person is suffering. It is a combination of the inflation rate and the unemployment rate.
- Unadjusted vs. Seasonally Adjusted Unemployment Rate- Often it appears that the Seasonally Adjusted numbers are going one way, while the unadjusted numbers are going in the opposite direction. Here is how it looks in chart form.
- Seasonally Adjusted Unemployment Rate in Table form- If you want to see the actual numbers.
- Is the Government Fudging Unemployment Numbers? Now there is an alternative measurement. We can also see a discrepancy in the Government’s own numbers by looking at the Employment vs. UnEmployment rate.
- U-6 is the broadest measure of unemployment and includes all classes of Unemployed plus those ”marginally attached” and/or part-time for economic reasons. See What is the U-6 Unemployment Rate? for more details of all the “U” classifications.
- What is the “Real” Unemployment Rate? Many economists believe that the popularly quoted Unemployment Rate understates the real unemployment rate because it fails to include workers who would like to work but have given up looking because they don’t think there are any jobs available for them.
- State Employment and Unemployment Rates- September 2012 including political party affiliation Which States have the highest unemployment and how does that relate to Political party?
- Minimum Wages vs Unemployment- Will raising the minimum wage make the poor richer? A perfect real life example that illustrates what happens when the government tries to legislate wealth. My friend Jeff just posted this on Facebook. “My job was cut from 40 to 25 hours a week so that my employer will not have to pay health insurance due to the (UN) Affordable Health Care act. My insurance went up $100 so that the IRS can enforce the (UN) Affordable Health Care Act. Thank you Mr. President.” So this is how the government “helps” the poor through legislation… cut their hours and raise their taxes.


![[Google]]( http://unemploymentdata.com/wp-content/plugins/easy-adsense/google-light.gif)
